Table of Contents
- 1. Introduction
- 2. Data Gaps in Manufacturing and Logistics Operations
- 3. How Power BI Addresses the Data Gaps
- 4. Microsoft Fabric vs Power BI: Which One Does Your Operation Need?
- 5. Use Cases of Power BI for Manufacturing and Logistics
- 6. Implementing Power BI in Manufacturing and Logistics
- 7. Common Mistakes to Avoid
- 8. Conclusion
- 9. FAQs
Manufacturing and logistics operations generate data across production systems, warehouse tools, transport platforms, and spreadsheets. In many businesses, this data stays separated.
This creates a visibility problem. Production output does not match reported figures. Inventory records differ from actual stock levels. Shipment status is updated late.
Power BI for manufacturing and logistics addresses this by connecting to existing systems and consolidating data into a single reporting layer. It pulls data from ERP systems, warehouse systems, and third-party logistics platforms and presents it through structured dashboards. This gives operations teams a consistent, accurate view across the entire supply chain.
Data Gaps in Manufacturing and Logistics Operations
Manufacturing and logistics operations typically face four data gaps:
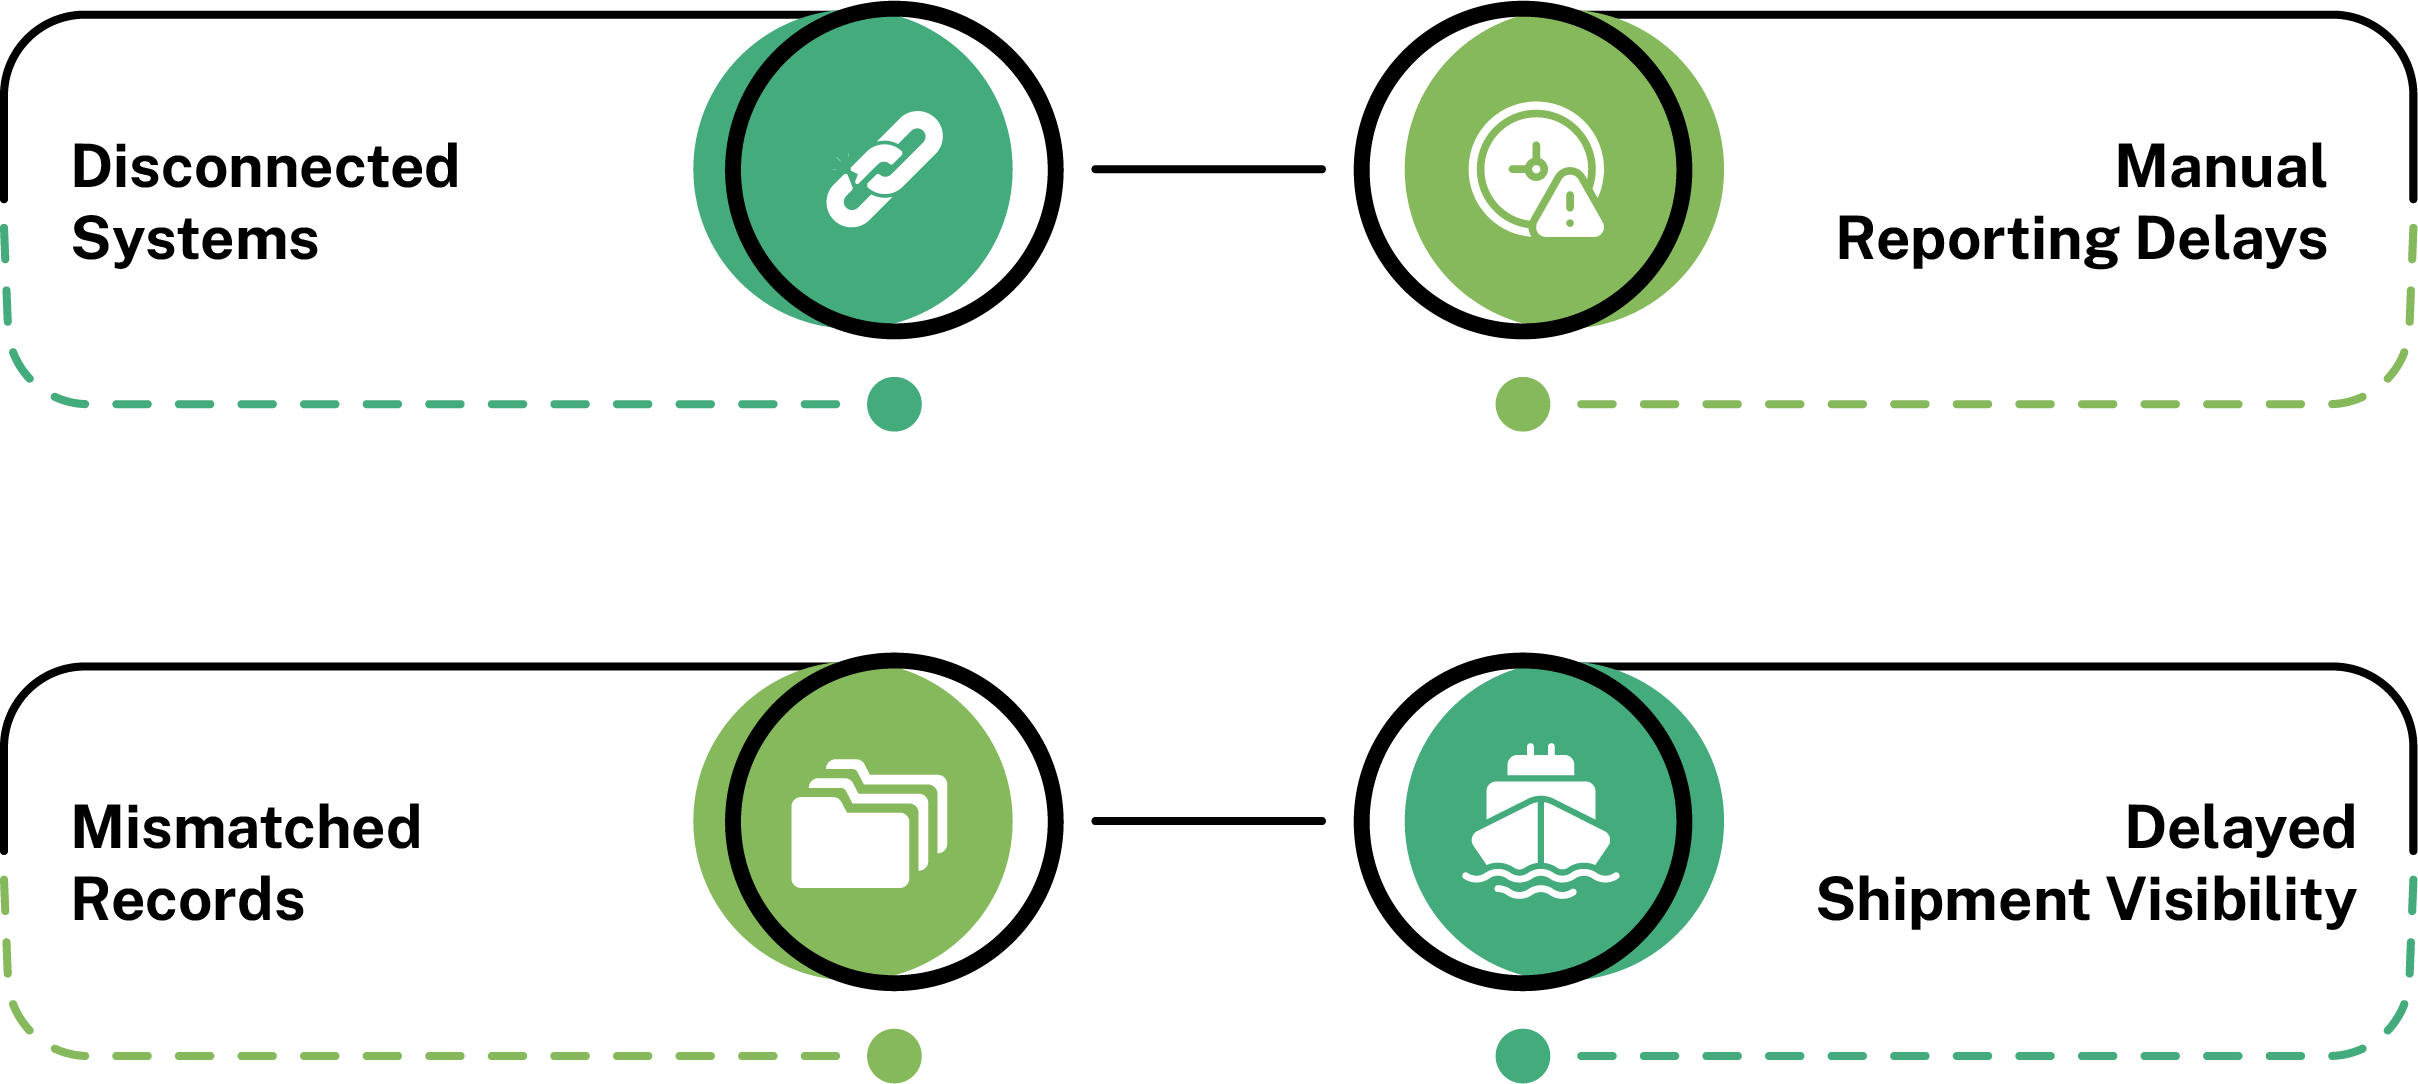
These gaps slow decisions, create reconciliation work, and introduce errors that compound across departments. The problem is not a lack of data. It is that the data exists in isolation, with no unified layer to bring it together and make it available when decisions need to be made.
How Power BI Addresses the Data Gaps
Power BI for manufacturing and logistics connects to existing systems and consolidates operational data into a single reporting layer without replacing any existing tools.
Data Integration
Power BI uses built-in and custom connectors to pull data simultaneously from ERP platforms, warehouse management systems, transport tools, and spreadsheets. All source data lands in one place, structured and ready for reporting.
Automated Reporting
Power BI schedules data refresh at set intervals or connects to live data streams, depending on the source. Reports update automatically and are available to teams without anyone pulling numbers or formatting a spreadsheet.
Centralized Data Access
Instead of each department maintaining its own version of operational data, Power BI creates one dataset that all teams read from. A warehouse manager and a production supervisor looking at inventory figures see the same number at the same time.
Live Tracking
A Power BI supply chain analytics dashboard connects to transport and logistics feeds and reflects shipment status, carrier updates, and delivery timelines as they change. Logistics teams do not need to chase updates from carriers or check separate platforms.
Apart from Power BI, Microsoft Fabric is another tool in the Microsoft ecosystem built for data and analytics. Both serve different purposes, and knowing which one a manufacturing or logistics operation needs is essential for building the right data foundation.
Microsoft Fabric vs Power BI: Which One Does Your Operation Need?
| Power BI | Microsoft Fabric | |
|---|---|---|
| Primary Focus | Reporting and visualization | End-to-end data platform |
| Best For | Connecting existing systems and building dashboards | Managing complex data pipelines and large-scale data infrastructure |
| Implementation Complexity | Low | High |
| When to Use | When the operation needs visibility across production, warehouse, and logistics | When the organization is planning a broader data modernization program |
For most manufacturing and logistics operations, Power BI is the practical starting point. Microsoft Fabric becomes relevant when the data infrastructure itself needs to be rebuilt.
Use Cases of Power BI for Manufacturing and Logistics
Production Monitoring
A plant running three shifts generates output data across multiple lines throughout the day. With Power BI, output across all lines and shifts is visible in one dashboard. When a line drops below target mid-shift, the production team sees it in time to act, not after the shift closes.
Inventory Tracking
A warehouse managing thousands of SKUs across multiple locations cannot rely on periodic stock counts. Data analytics for warehouse management through Power BI reflects stock movement as transactions happen. When a SKU drops below the reorder level, the warehouse team sees it without waiting for a manual audit.
Supply Chain Visibility
Procurement teams managing multiple suppliers need to know which orders are on track and which are at risk. A Power BI supply chain analytics dashboard consolidates order and delivery data from supplier systems and flags delays before they reach the production floor. A buyer can act on a late supplier before it becomes a line stoppage.
Logistics and Delivery Tracking
A logistics team managing outbound shipments across multiple carriers cannot track delivery status across separate platforms efficiently. Power BI consolidates tracking data from all carriers into one view and highlights shipments at risk of missing delivery windows. Teams identify delays as they develop and respond before the customer is affected.
Equipment and Asset Monitoring
A production facility running high-value machinery cannot afford unplanned downtime. Power BI connects to machine sensors and control systems, tracking cycle time, output rate, and downtime events by equipment and shift. When a machine shows irregular patterns, the maintenance team schedules intervention before the equipment fails.
Getting Power BI running across manufacturing and logistics operations takes more than connecting data sources and building dashboards. How it is set up determines whether the data is accurate, current, and actionable.
Implementing Power BI in Manufacturing and Logistics
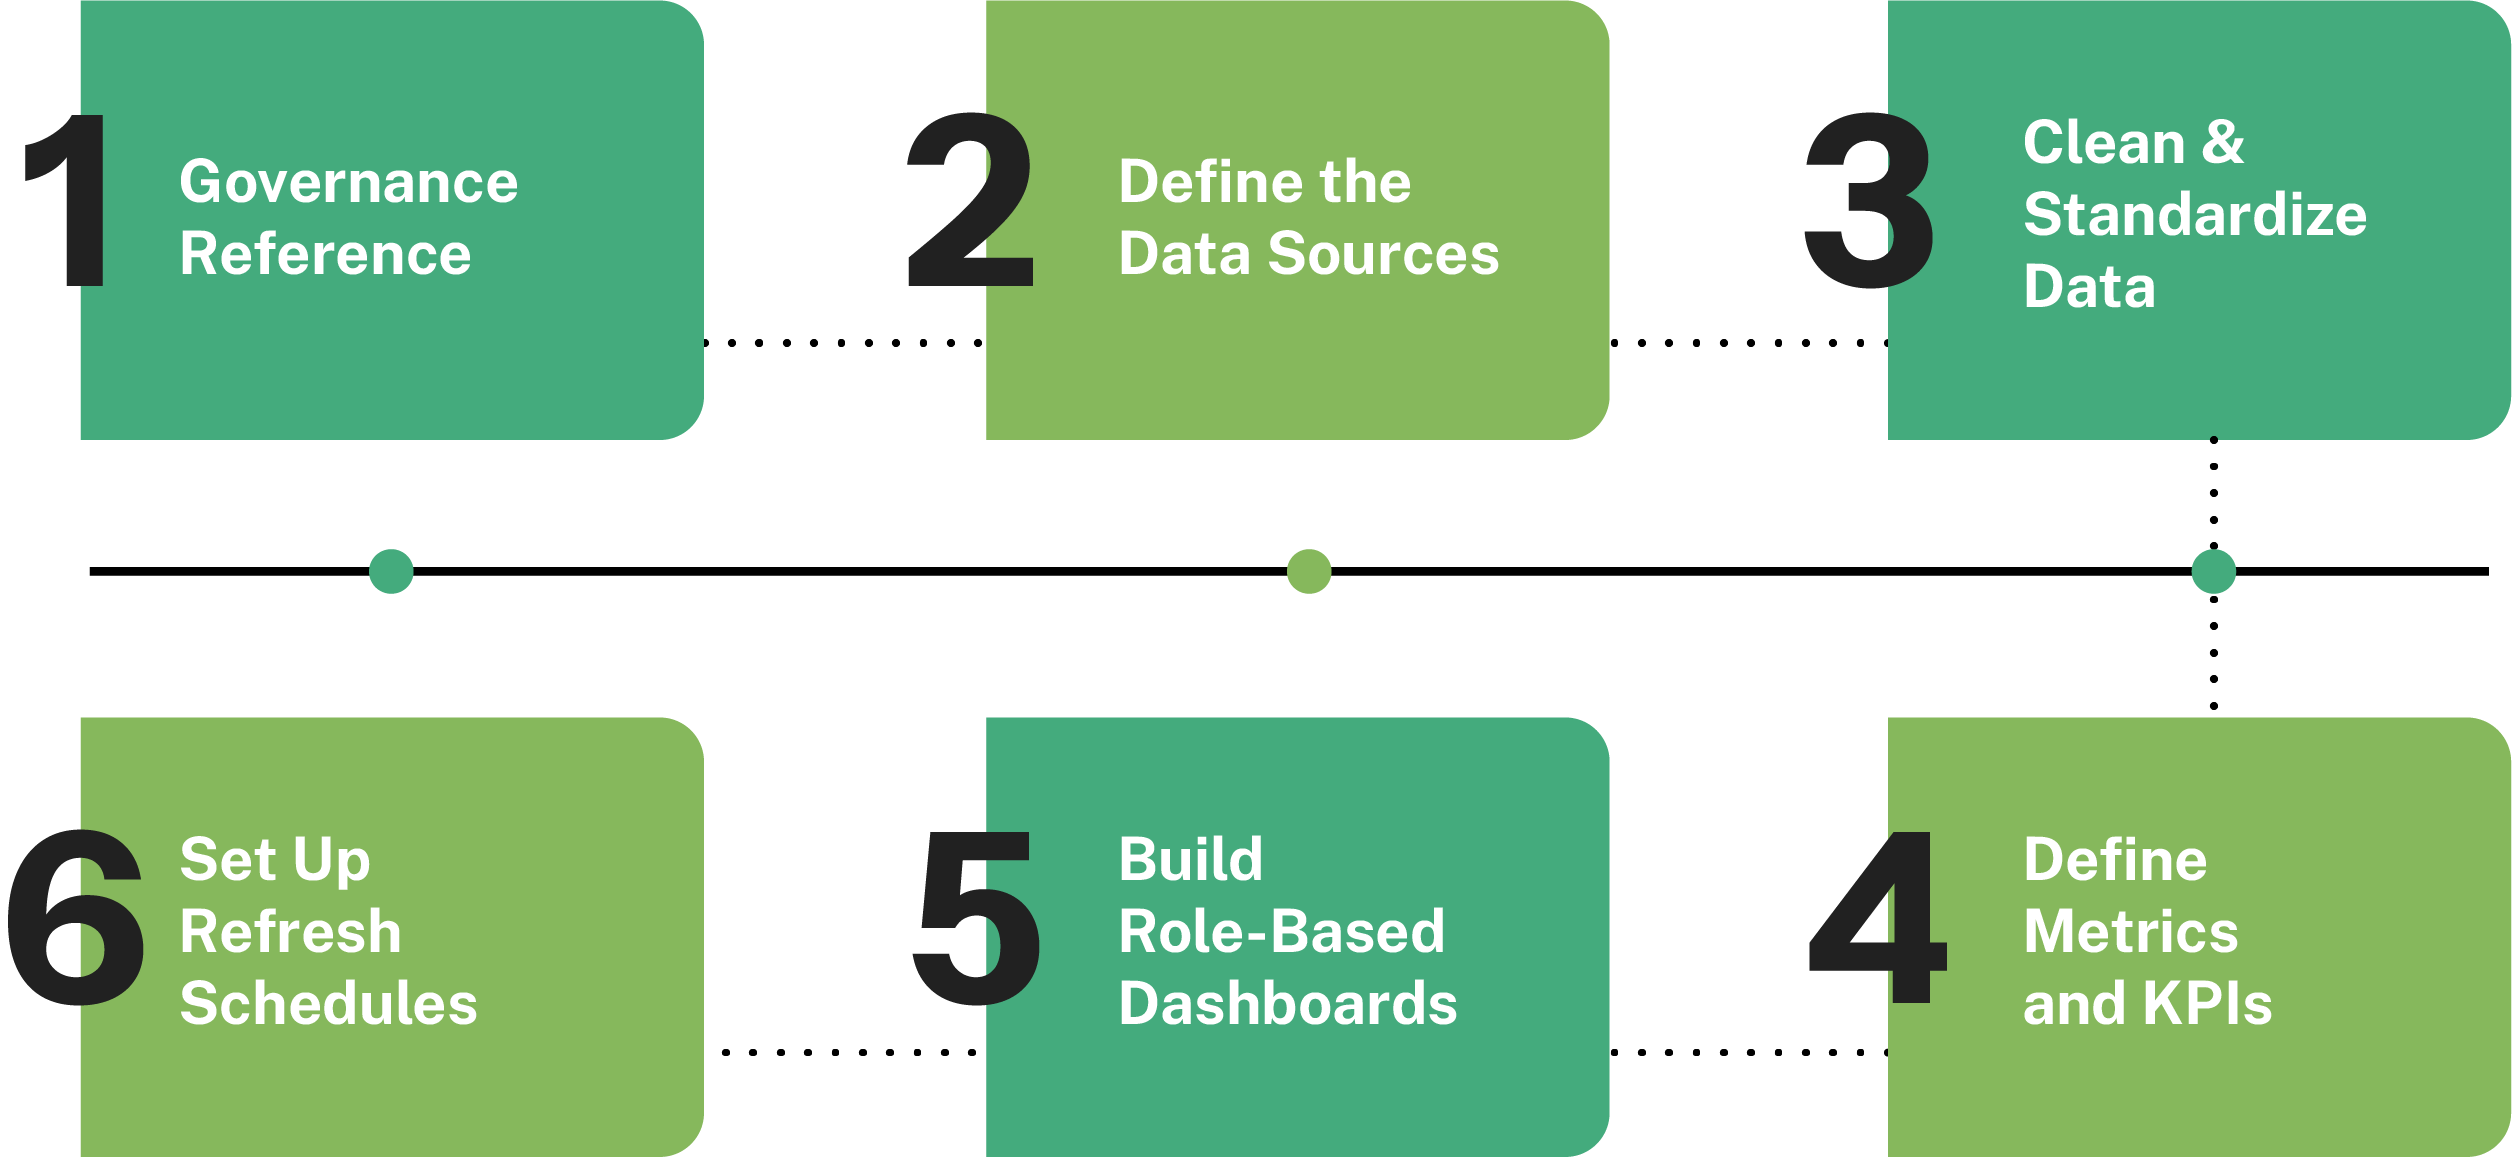
1. Define the Data Sources
Before building dashboards, all operational data sources need to be identified. This includes ERP systems, warehouse management platforms, transport tools, and spreadsheets used for reporting. Mapping these sources early helps avoid missing or duplicate data later.
2. Clean and Standardize Data
Data from multiple systems rarely follows the same structure. Field names, date formats, and inventory records often differ across platforms. Power Query in Power BI helps clean and standardize this data before reporting begins.
3. Define Metrics and KPIs
Dashboards become difficult to use when teams do not agree on what should be measured. KPIs such as production output, stock accuracy, on-time delivery, and equipment downtime should be clearly defined before reports are designed.
4. Build Role-Based Dashboards
Different teams need different views of operational data. A production supervisor, warehouse manager, and logistics coordinator should each see dashboards relevant to their responsibilities instead of one overloaded report.
5. Set Up Refresh Schedules
Data refresh schedules should match how frequently operational data changes. Production systems may require near real-time updates, while supplier or procurement data may refresh less frequently. Proper scheduling keeps dashboards accurate and reliable.
Even with the right implementation steps, certain mistakes consistently undermine Power BI deployments in manufacturing and logistics environments.
Common Mistakes to Avoid
- Connecting too many data sources at once: Trying to integrate every system immediately creates unnecessary complexity. Start with a few high-priority data sources, stabilize reporting, and expand gradually.
- Building dashboards before defining metrics: Dashboards should support business decisions, not just display charts. Metrics need to be defined first, so teams know exactly what the reports are measuring.
- Ignoring data quality: Power BI reflects the quality of the source data. If inventory, production, or shipment records are inaccurate in the original system, the dashboards will also be inaccurate.
- Building one dashboard for everyone: Production, warehouse, and logistics teams all work differently. Separate role-based dashboards make reporting easier to use and more relevant for each department.
- Treating implementation as a one-time project: Operational systems and reporting requirements change over time. Dashboards, refresh schedules, and data models should be reviewed regularly to keep reporting aligned with business needs.
Conclusion
Disconnected data is one of the most common reasons manufacturing and logistics decisions are made late or on incomplete information. Power BI for manufacturing and logistics consolidates data from production, warehouse, and logistics systems into a single reporting layer that updates without manual intervention. For businesses looking to move from reactive to structured decision-making, it is a practical starting point that works with existing systems.
FAQs
1. What is data analytics for warehouse management?
It is the process of collecting and analyzing stock movement, inventory levels, and fulfillment data to help warehouse teams make faster, more accurate operational decisions.
2. How does Power BI vs Tableau compare in the manufacturing industry?
Power BI integrates more natively with Microsoft ecosystems common in manufacturing. Tableau offers stronger standalone visualization but requires additional integration work with ERP and warehouse systems.
3. Microsoft Fabric vs Power BI: Which one does a manufacturing operation need?
Most manufacturing and logistics operations need reporting and visibility across existing systems, which is where Power BI fits. Fabric becomes relevant when the data infrastructure itself needs to be rebuilt.
4. What is Power BI predictive maintenance manufacturing?
It refers to using Power BI dashboards connected to machine sensors to monitor equipment performance, identify irregular patterns, and schedule maintenance before unplanned failures occur.