Businesses deal with large volumes of data across sales, marketing, finance, and operations. But without the right way to present it, data remains difficult to interpret and use. Reports take time, insights get delayed, and decision-making slows down.
Power BI dashboards solve this by presenting metrics in a single, visual view. Instead of going through multiple reports or spreadsheets, teams can track performance, identify trends, and act on data in real time.
In this blog, we’ll look at practical Power BI dashboard examples across different business use cases to help you understand how they are applied.
Why Businesses Use Power BI Dashboards
Clear Insights: Organizes and visualizes data so teams can understand trends and performance without relying on spreadsheets, making it easier to interpret information and act on insights quickly and consistently.
Automated Tracking: Updates metrics automatically as data changes, removing the need for repeated manual reporting and helping teams save time while ensuring information remains accurate and consistently available.
Centralized Metrics: Combines data from multiple sources into one view, ensuring everyone works with consistent information, reducing confusion, and improving coordination across teams involved in different business functions.
What Makes a Good Power BI Dashboard
- Clear KPIs: Metrics should be clearly defined and directly tied to business goals, so users understand what is being measured without confusion or unnecessary interpretation.
- Usable Layout: Information should be structured in a clean and logical way, allowing users to navigate easily and focus on important data without getting distracted by clutter.
- Updated Data: Data should be refreshed regularly to ensure accuracy, so decisions are based on current information rather than outdated reports or delayed updates.
- Actionable Insights: The dashboard should highlight patterns, trends, or issues clearly, helping users take action instead of just viewing data without knowing what to do next.
Power BI Dashboard Examples by Use Case
Here are the most common Power BI use cases where dashboards are applied across different business functions.
Power BI Sales Dashboard Examples
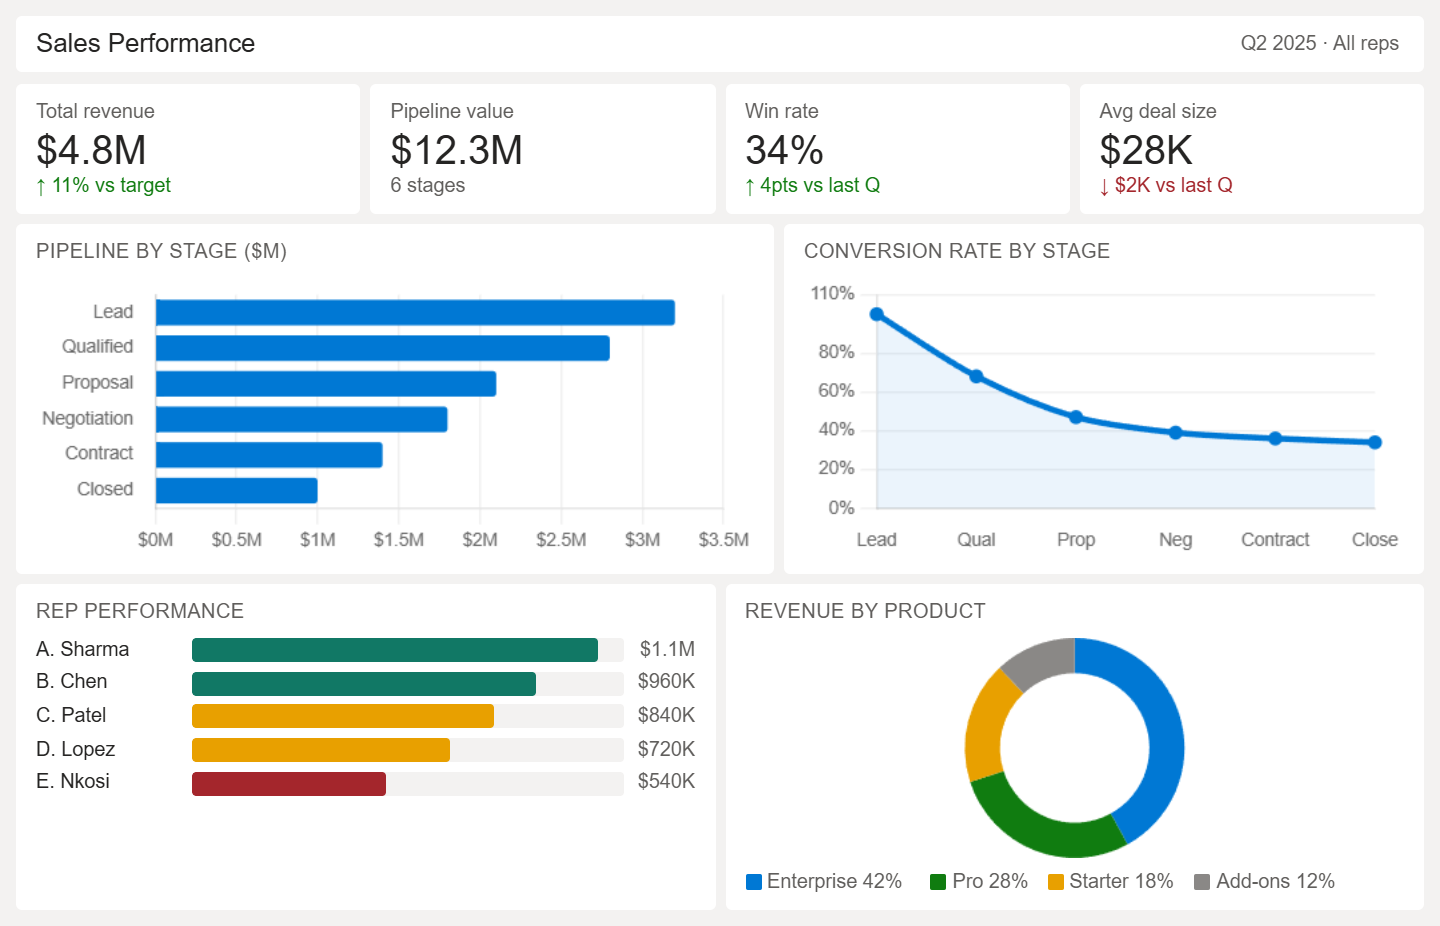
A sales performance dashboard tracks how effectively the sales pipeline converts leads into revenue across stages of the sales cycle.
- Tracks revenue against targets over time periods
- Breaks the pipeline into stages from lead to closure
- Measures conversion rates between stages
- Compares sales reps by deal value and win rate
- Tracks average deal size and sales cycle length
- Shows product contribution to revenue
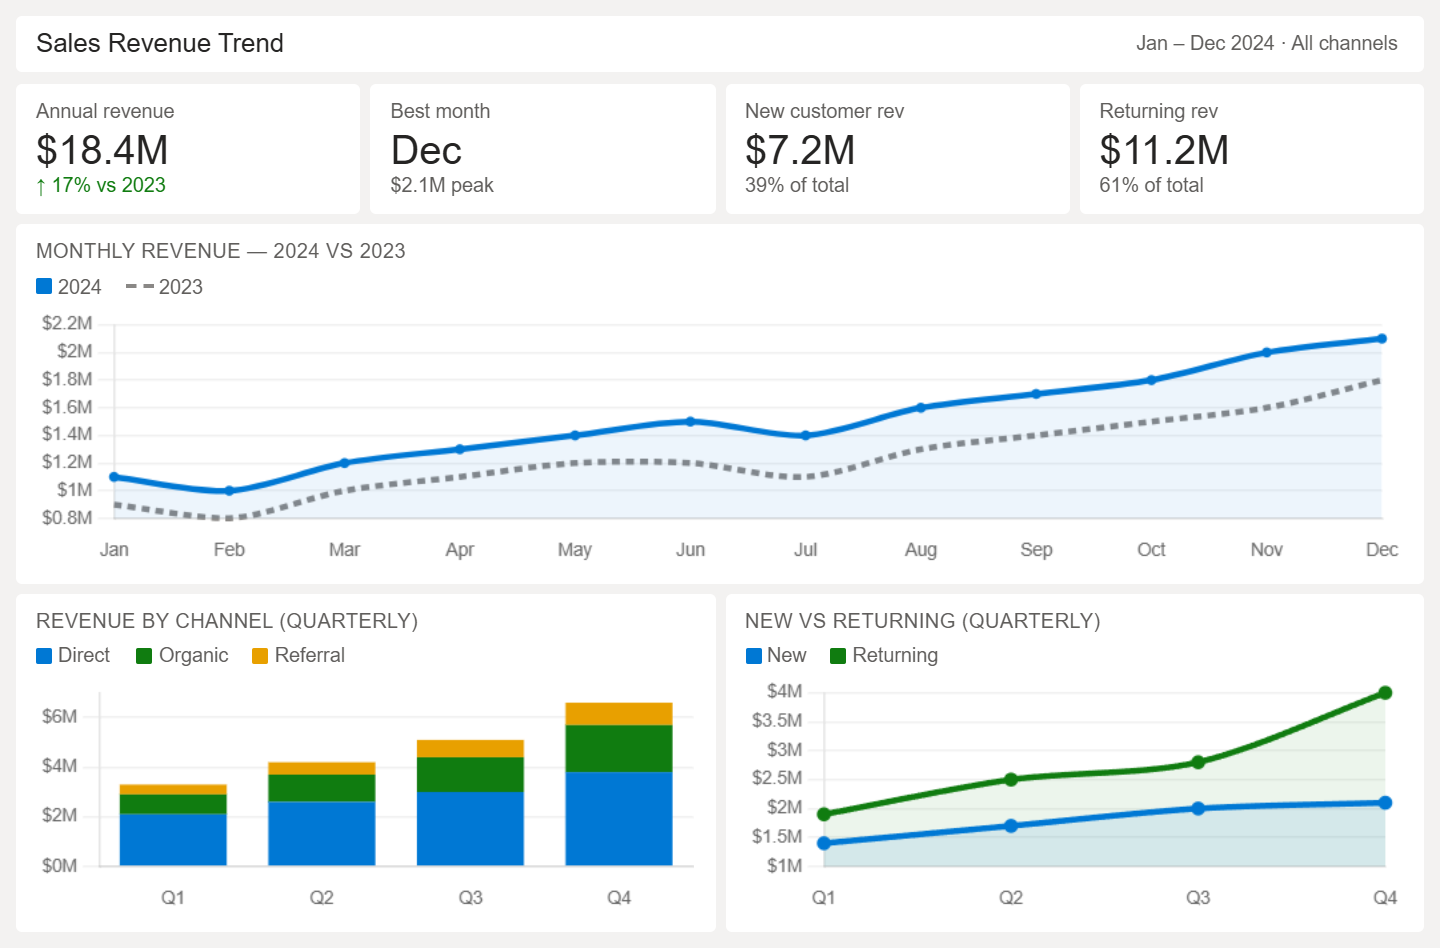
A sales revenue trend dashboard shows how revenue changes over time and highlights patterns behind growth or decline.
- Tracks revenue across daily, monthly, and yearly timelines
- Compares performance across different periods
- Highlights seasonal spikes and slowdowns
- Breaks revenue by product, category, or channel
- Separates new and returning customer revenue
- Links revenue changes to campaigns or events
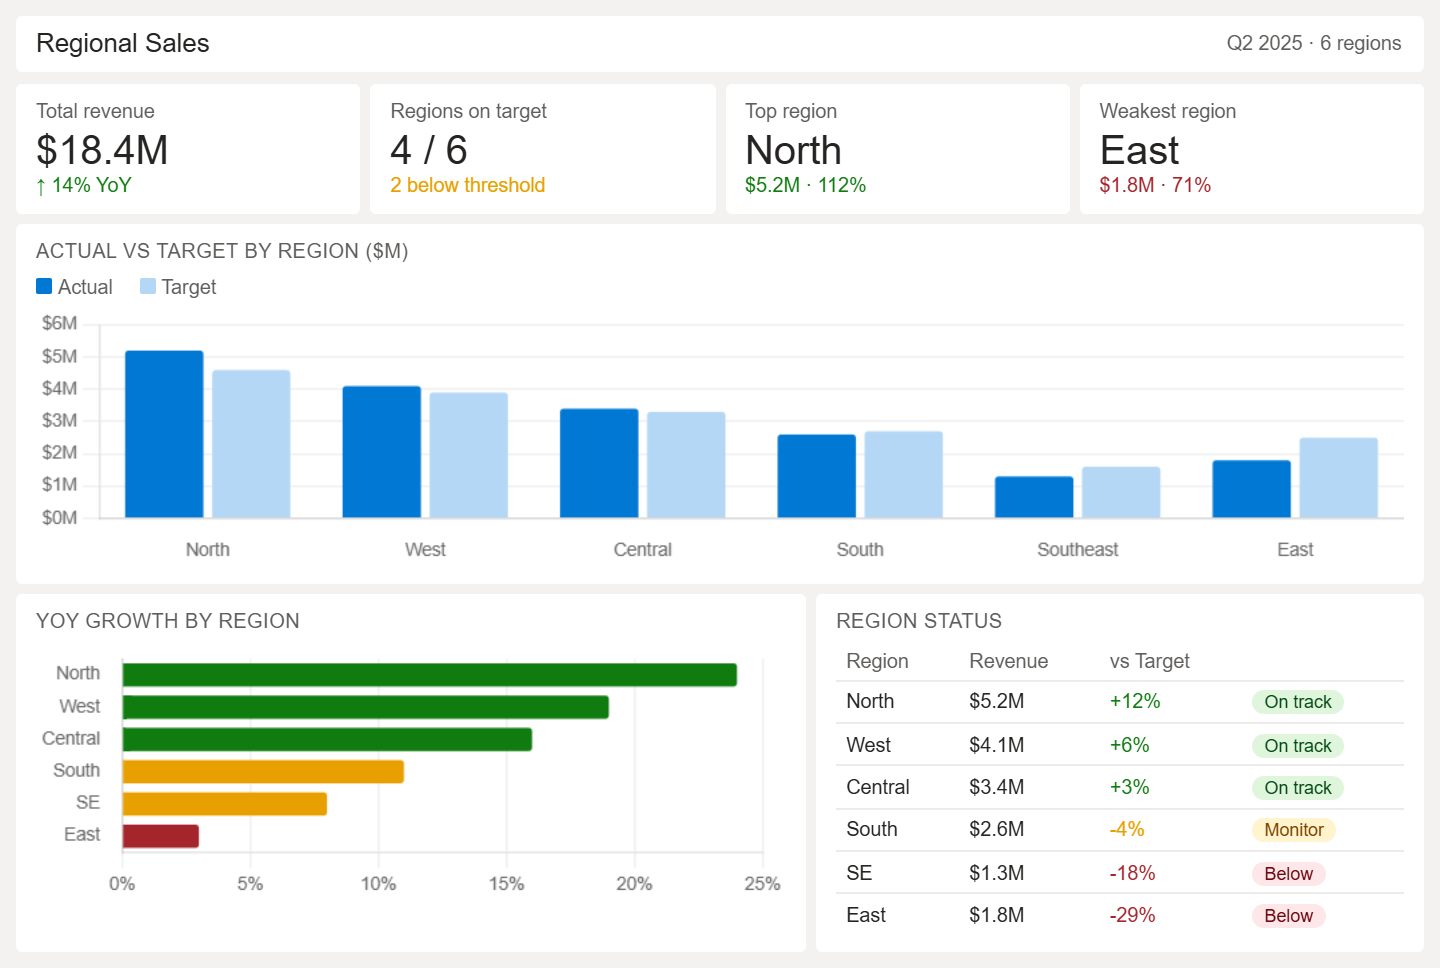
A regional sales dashboard compares sales performance across geographic locations to identify strong and weak markets.
- Shows revenue distribution across regions, cities, or territories
- Compares growth rates across locations over time
- Tracks target vs actual performance by region
- Identifies top and underperforming areas
- Highlights product demand differences
- Reveals gaps in coverage and weak territories
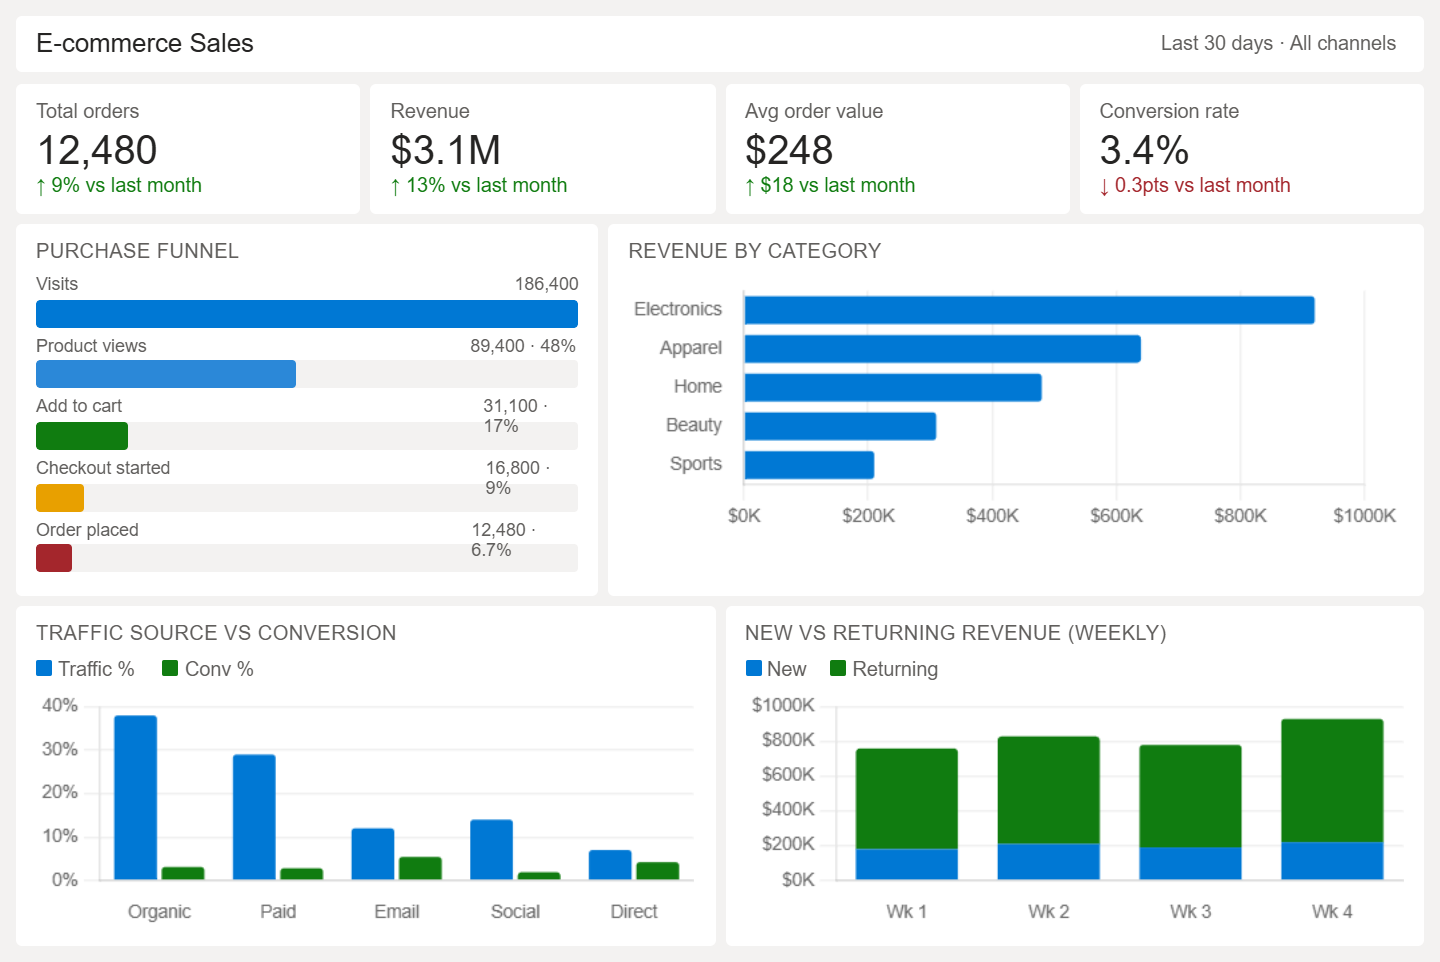
An e-commerce sales dashboard tracks online sales performance and customer buying behavior across the purchase journey.
- Tracks total orders, revenue, and average order value
- Measures conversion rates from visits to purchases
- Identifies cart abandonment points
- Analyzes product performance by category
- Breaks down traffic sources and impact on conversions
- Compares new vs returning customer behavior
Power BI Marketing & SEO Dashboard Examples
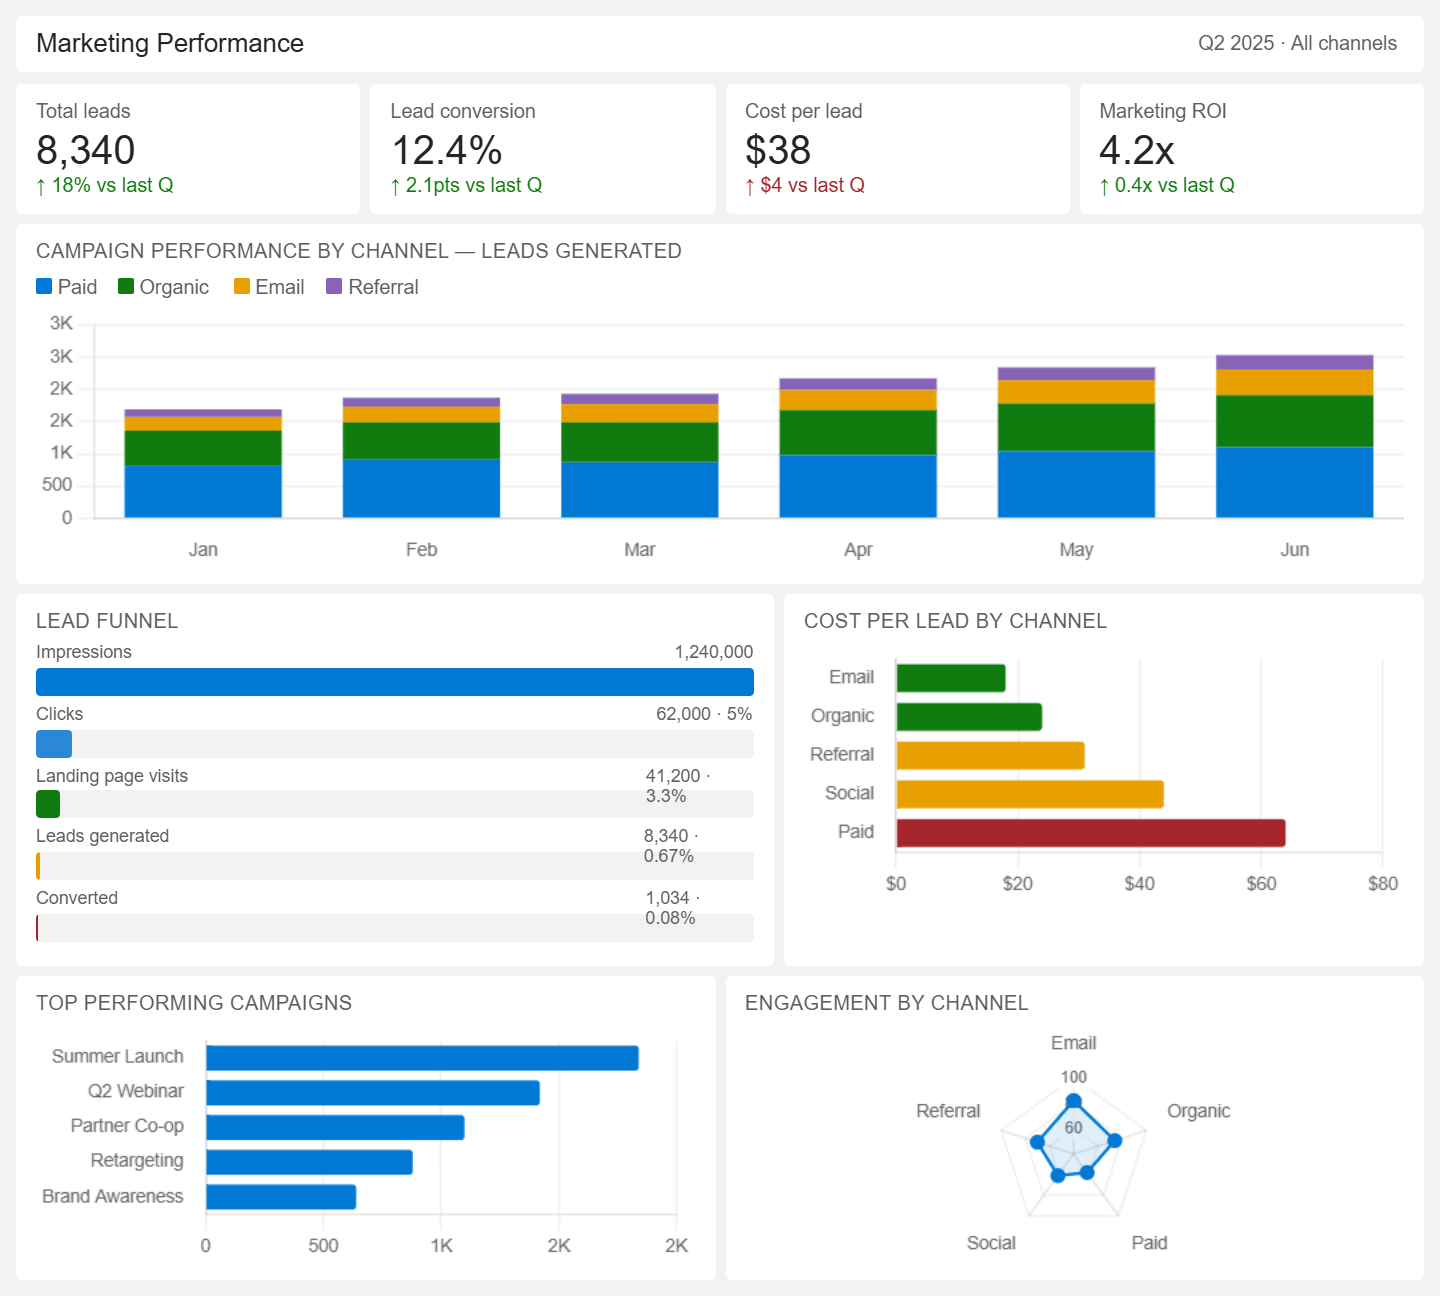
A marketing performance dashboard tracks how overall marketing activities contribute to leads, engagement, and conversions across channels.
- Tracks campaign performance across channels and time periods
- Measures lead generation and conversion rates from campaigns
- Compares the performance of paid, organic, and referral traffic
- Analyzes cost per lead and return on marketing spend
- Shows engagement metrics across campaigns and audiences
- Identifies top-performing campaigns and weak areas
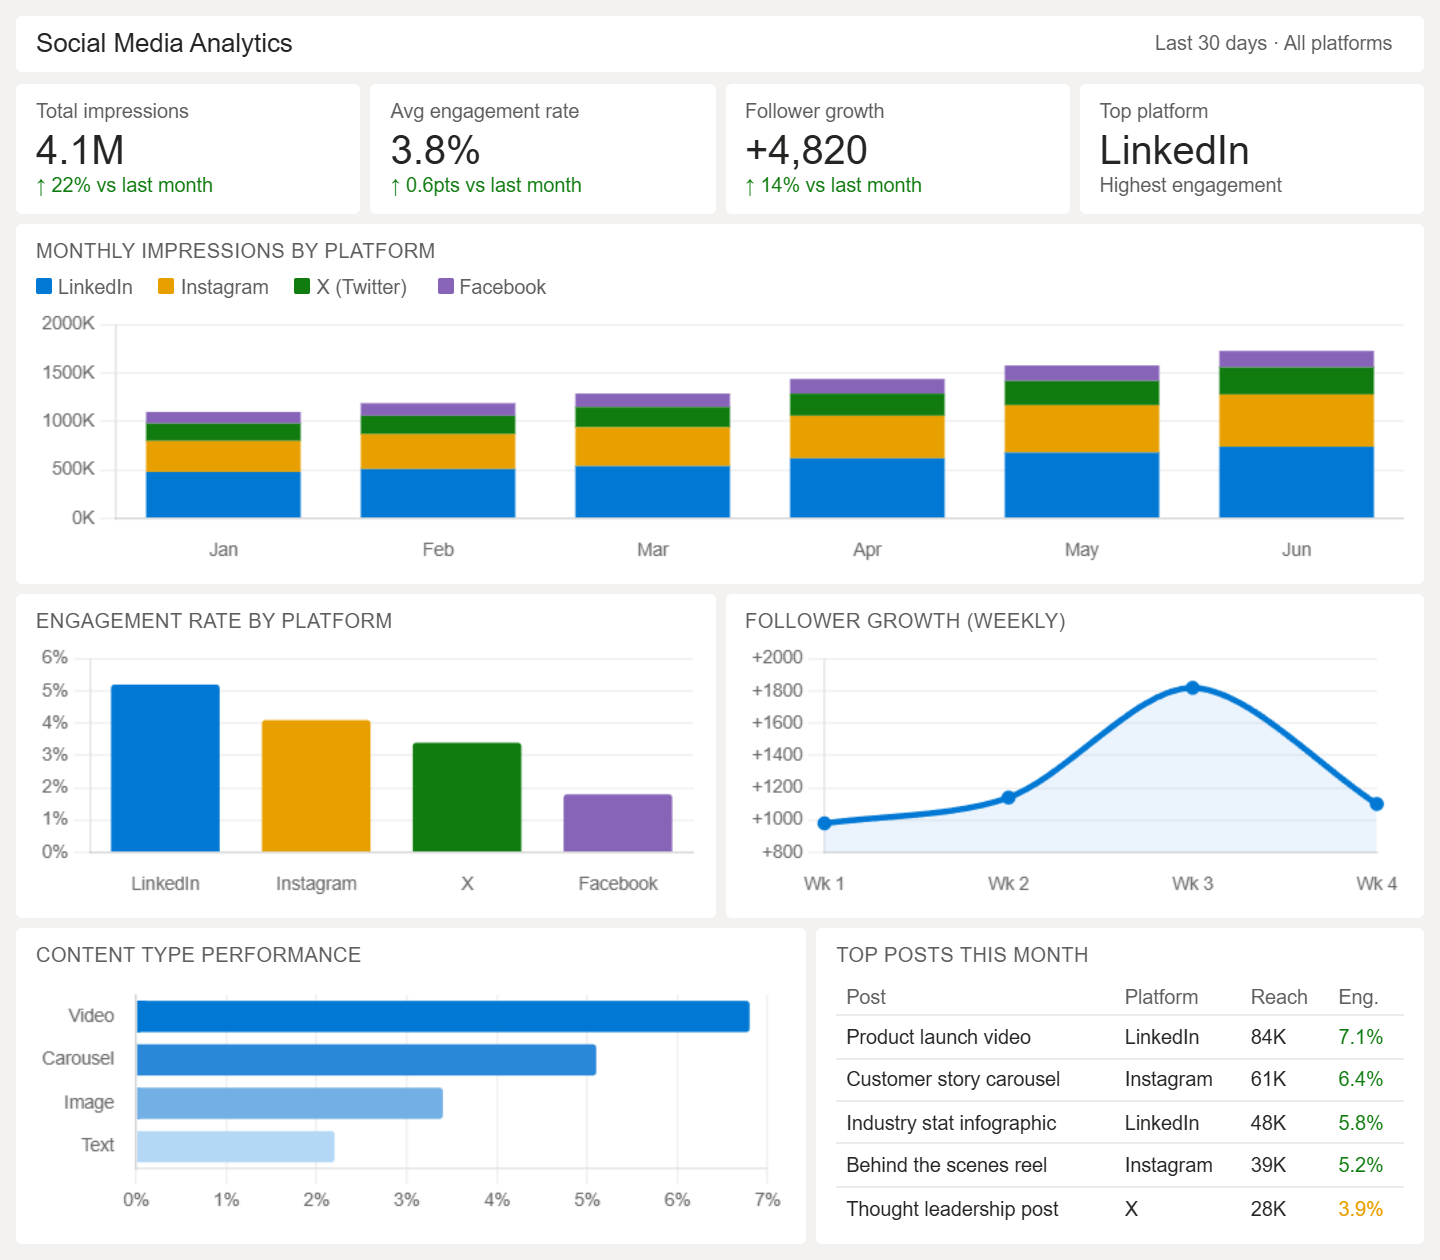
A social media analytics dashboard tracks how content performs across social platforms and how users engage with it.
- Tracks engagement metrics like likes, shares, and comments
- Measures reach and impressions across platforms
- Compares the performance of posts, campaigns, and content types
- Analyzes follower growth and audience trends
- Identifies best-performing content formats and topics
- Shows platform-wise traffic and engagement contribution
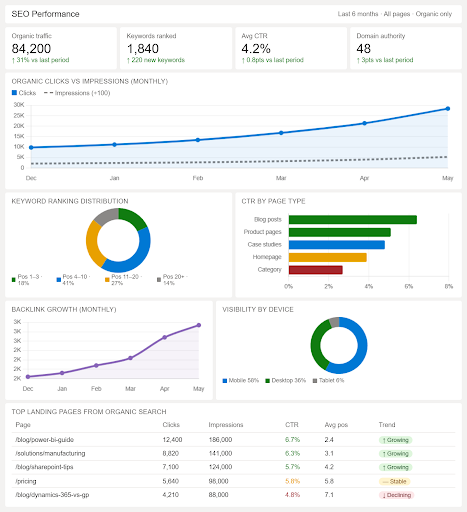
An SEO performance dashboard tracks how a website is performing in search engines and how organic traffic is growing.
- Tracks organic traffic trends across time periods
- Measures keyword rankings and visibility changes
- Analyzes click-through rates and impressions
- Shows top-performing landing pages from search
- Tracks backlinks and domain authority trends
- Identifies pages with high and low SEO performance
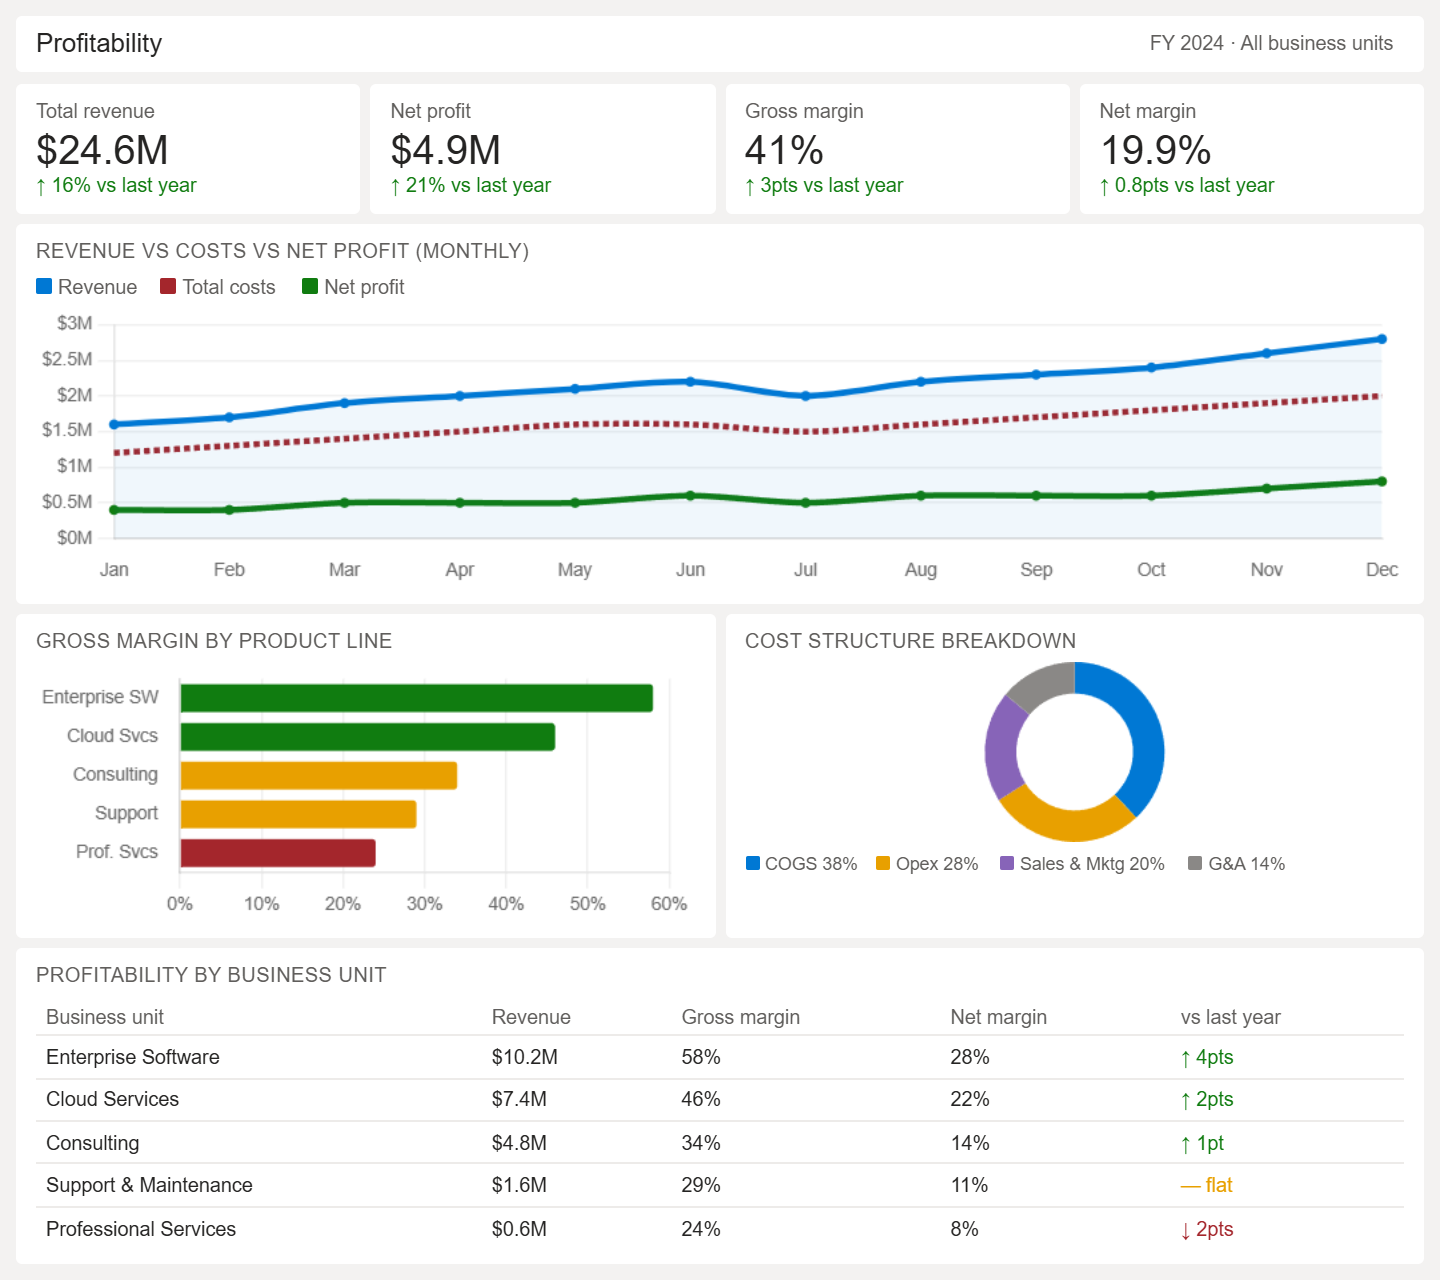
A profitability dashboard tracks how effectively a business is generating profit by comparing revenue with costs across different dimensions of the business.
- Tracks total revenue, costs, and net profit over time
- Breaks down profitability by product, service, or business unit
- Compares gross margin and net margin across periods
- Identifies high-profit and low-profit areas of the business
- Analyzes cost structure, including fixed and variable costs
- Highlights trends that impact overall business profitability
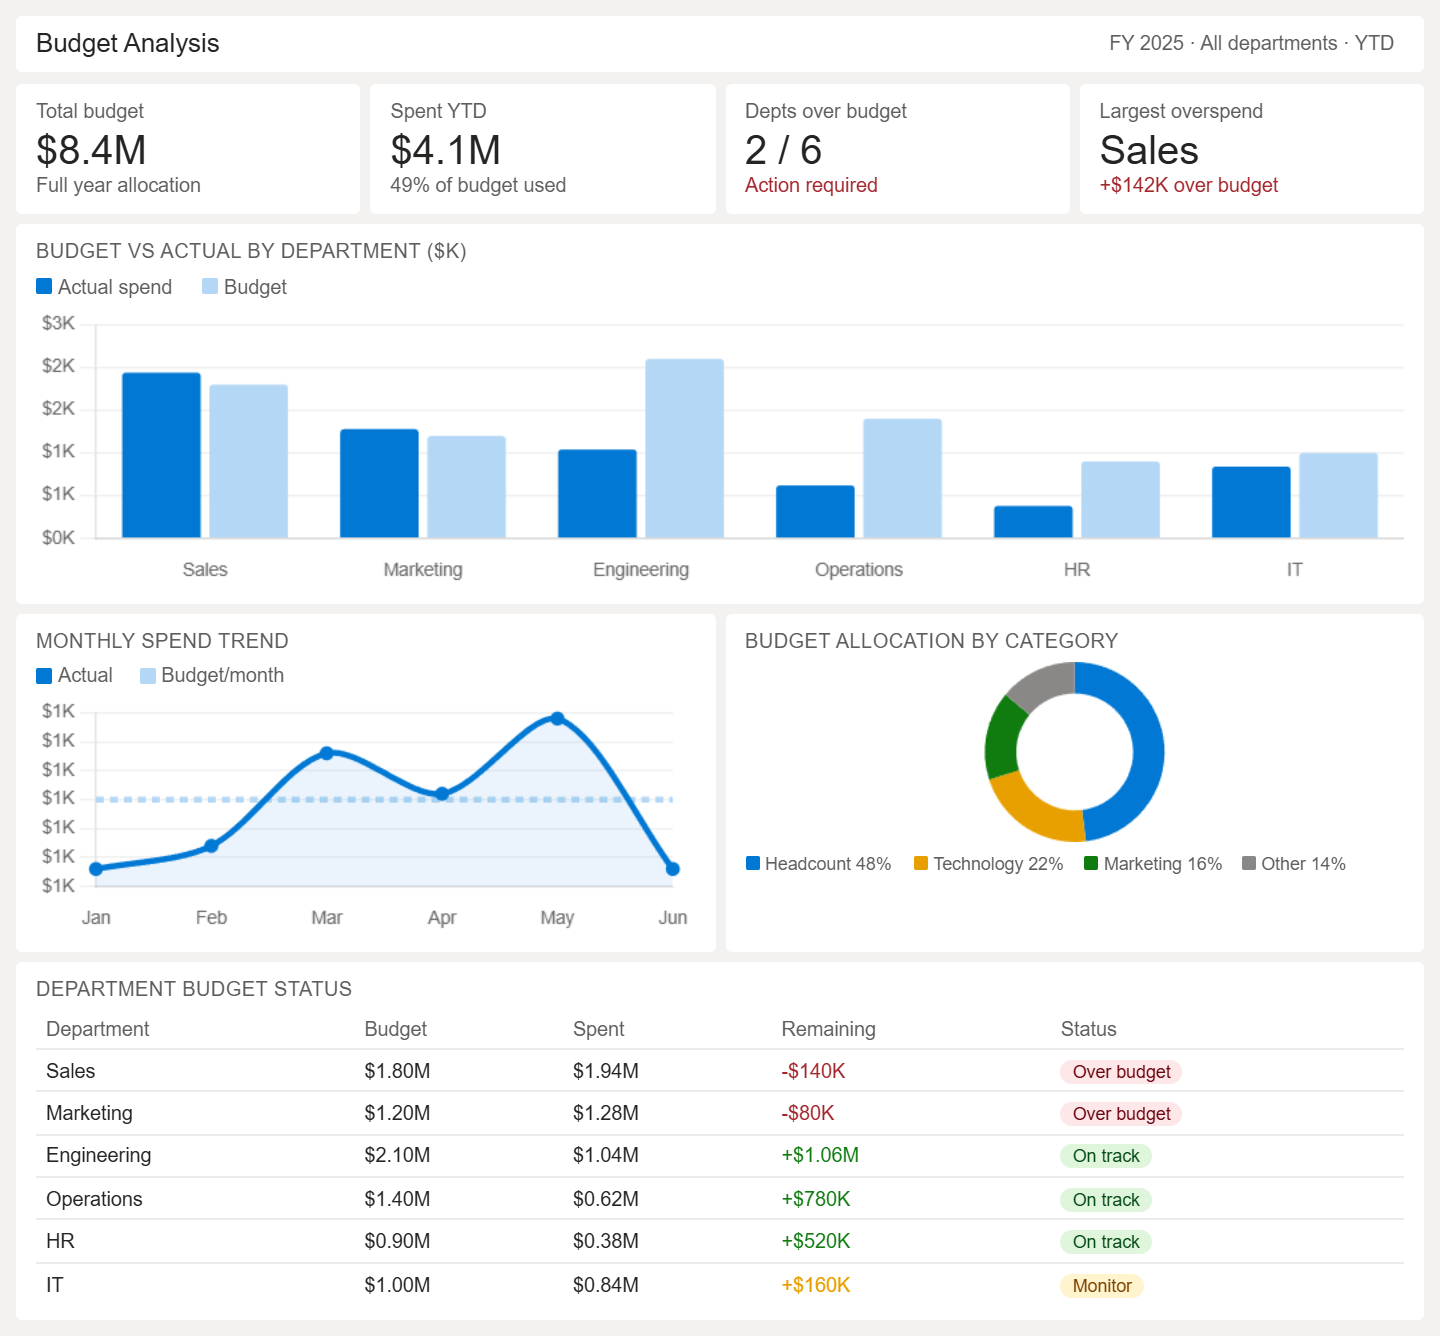
A budget analysis dashboard helps track planned budgets against actual spending across departments or projects.
- Compares budgeted vs actual expenses
- Tracks spending by department or cost center
- Identifies budget overruns and savings
- Analyzes monthly or quarterly budget trends
- Shows allocation of funds across categories
- Highlights areas of overspending or underutilization
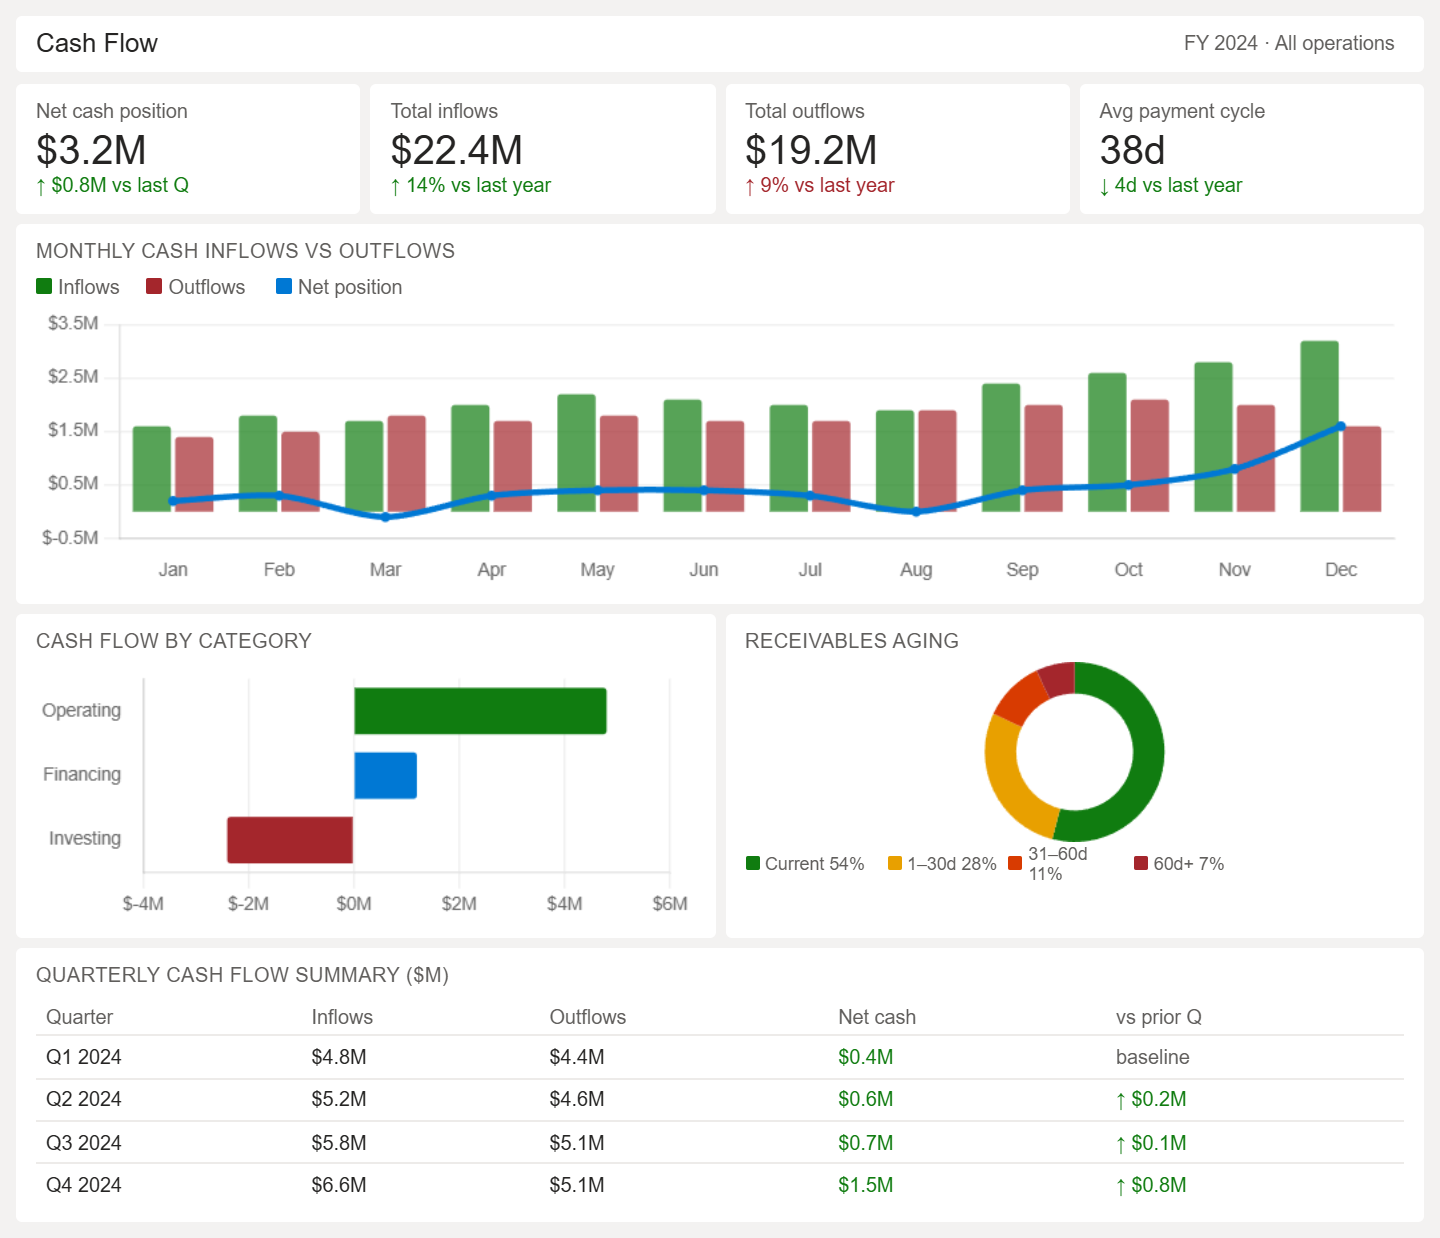
A cash flow dashboard tracks the movement of money in and out of the business to ensure liquidity and stability.
- Tracks cash inflows and outflows over time
- Shows operating, investing, and financing cash flow
- Monitors net cash position and liquidity levels
- Analyzes payment cycles and receivables
- Identifies cash shortages or surplus periods
- Highlights cash flow trends for financial planning
Power BI Operational Dashboard Examples
An inventory dashboard tracks stock levels, movement, and availability of products across warehouses or locations.
- Tracks cash inflows and outflows over time
- Shows operating, investing, and financing cash flow
- Monitors net cash position and liquidity levels
- Analyzes payment cycles and receivables
- Identifies cash shortages or surplus periods
- Highlights cash flow trends for financial planning
Power BI Operational Dashboard Examples
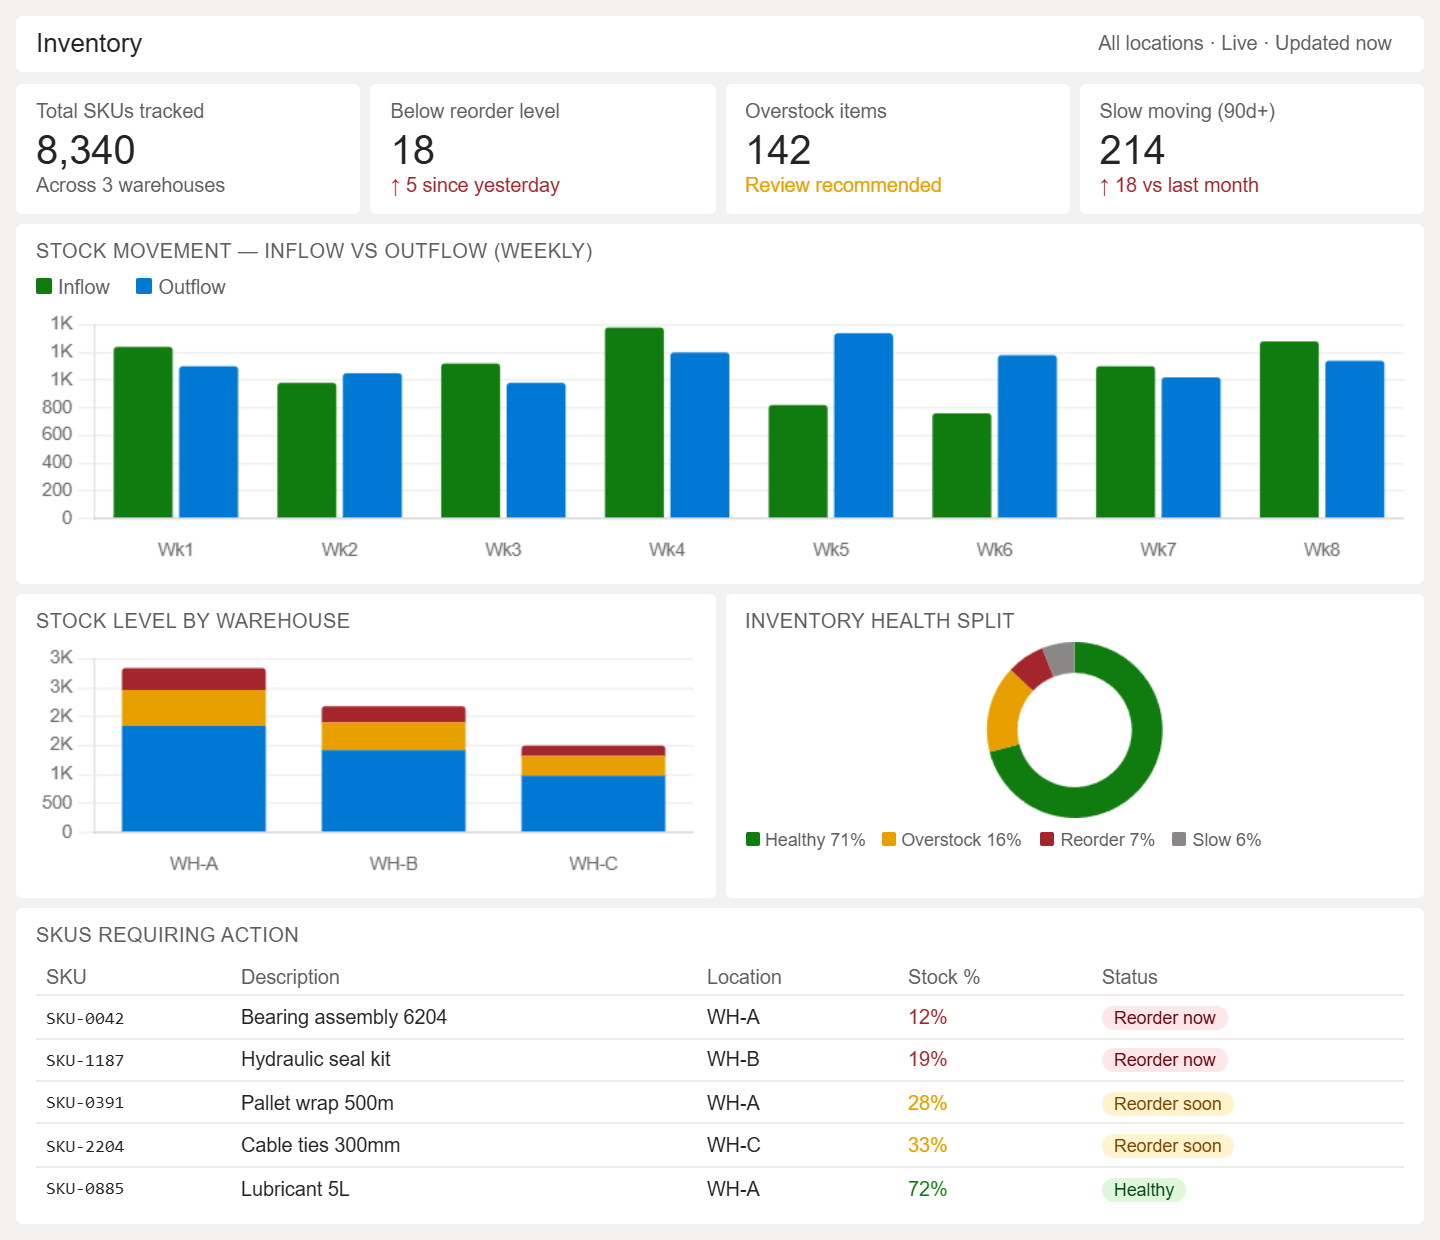
An inventory dashboard tracks stock levels, movement, and availability of products across warehouses or locations.
- Monitors current stock levels across items and locations
- Tracks stock movement, including inflow and outflow
- Identifies slow-moving and fast-moving inventory
- Highlights stock shortages and overstock situations
- Analyzes reorder levels and replenishment needs
- Shows product-wise inventory distribution
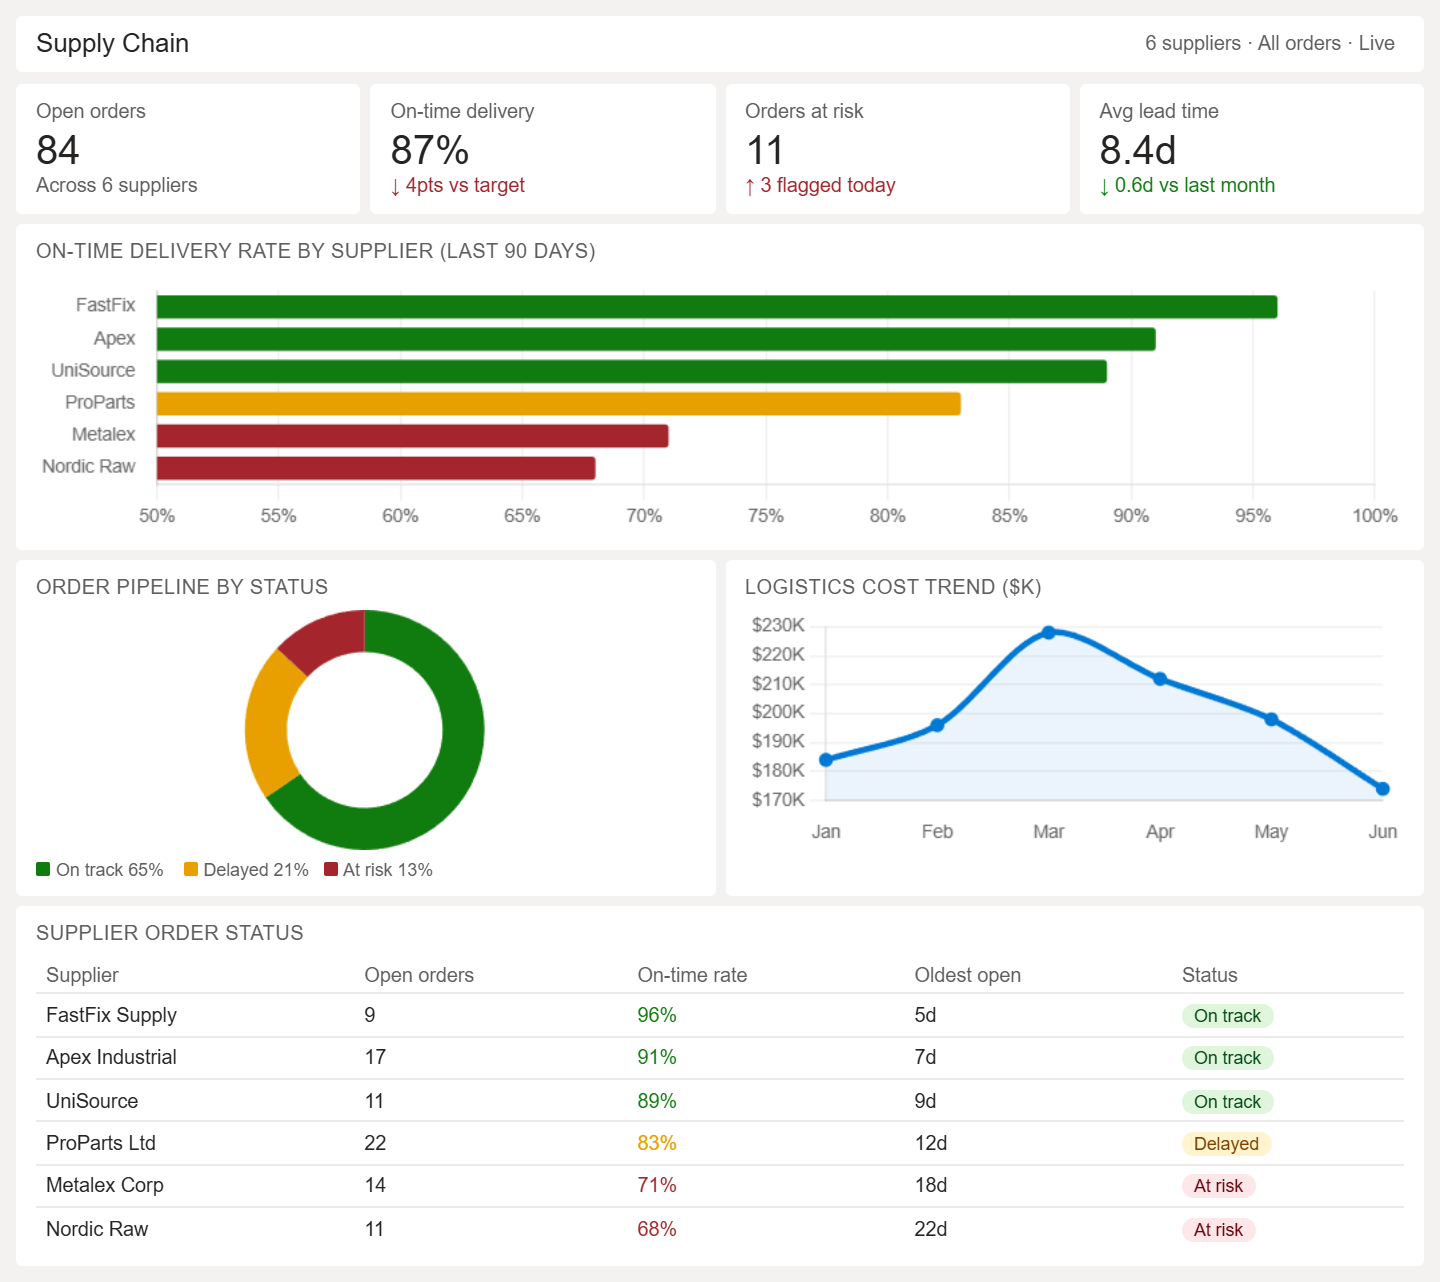
An inventory dashboard tracks stock levels, movement, and availability of products across warehouses or locations.
- Tracks supplier performance and delivery timelines
- Monitors procurement, production, and distribution flow
- Identifies delays and bottlenecks in supply chain stages
- Analyzes logistics costs and transportation efficiency
- Shows inventory movement across supply chain nodes
- Highlights order fulfillment status and leadtimes
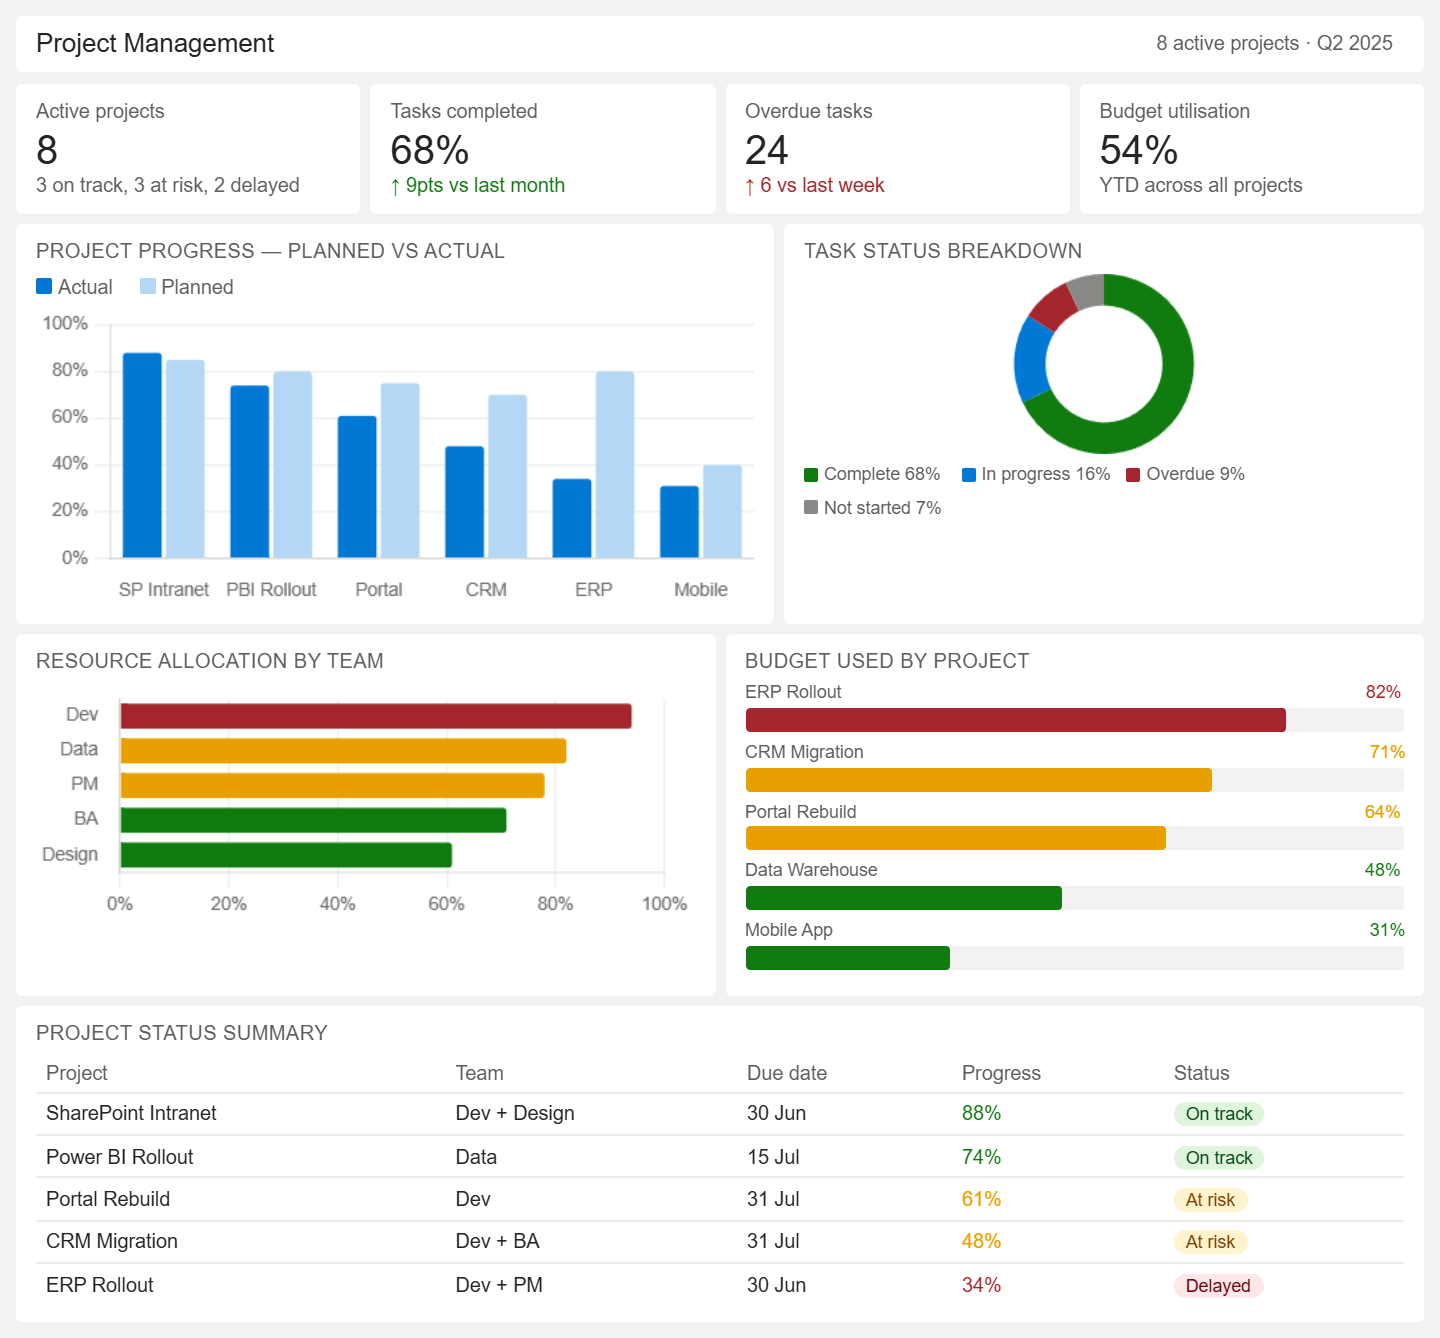
A project management dashboard tracks project progress, tasks, and resource allocation across teams.
- Monitors project status across timelines and milestones
- Tracks task completion, delays, and pending work
- Analyzes resource allocation and workload distribution
- Compares planned vs actual project progress
- Identifies risks, blockers, and project delays
- Shows budget utilization and project performance
Power BI HR & Executive Dashboard Examples
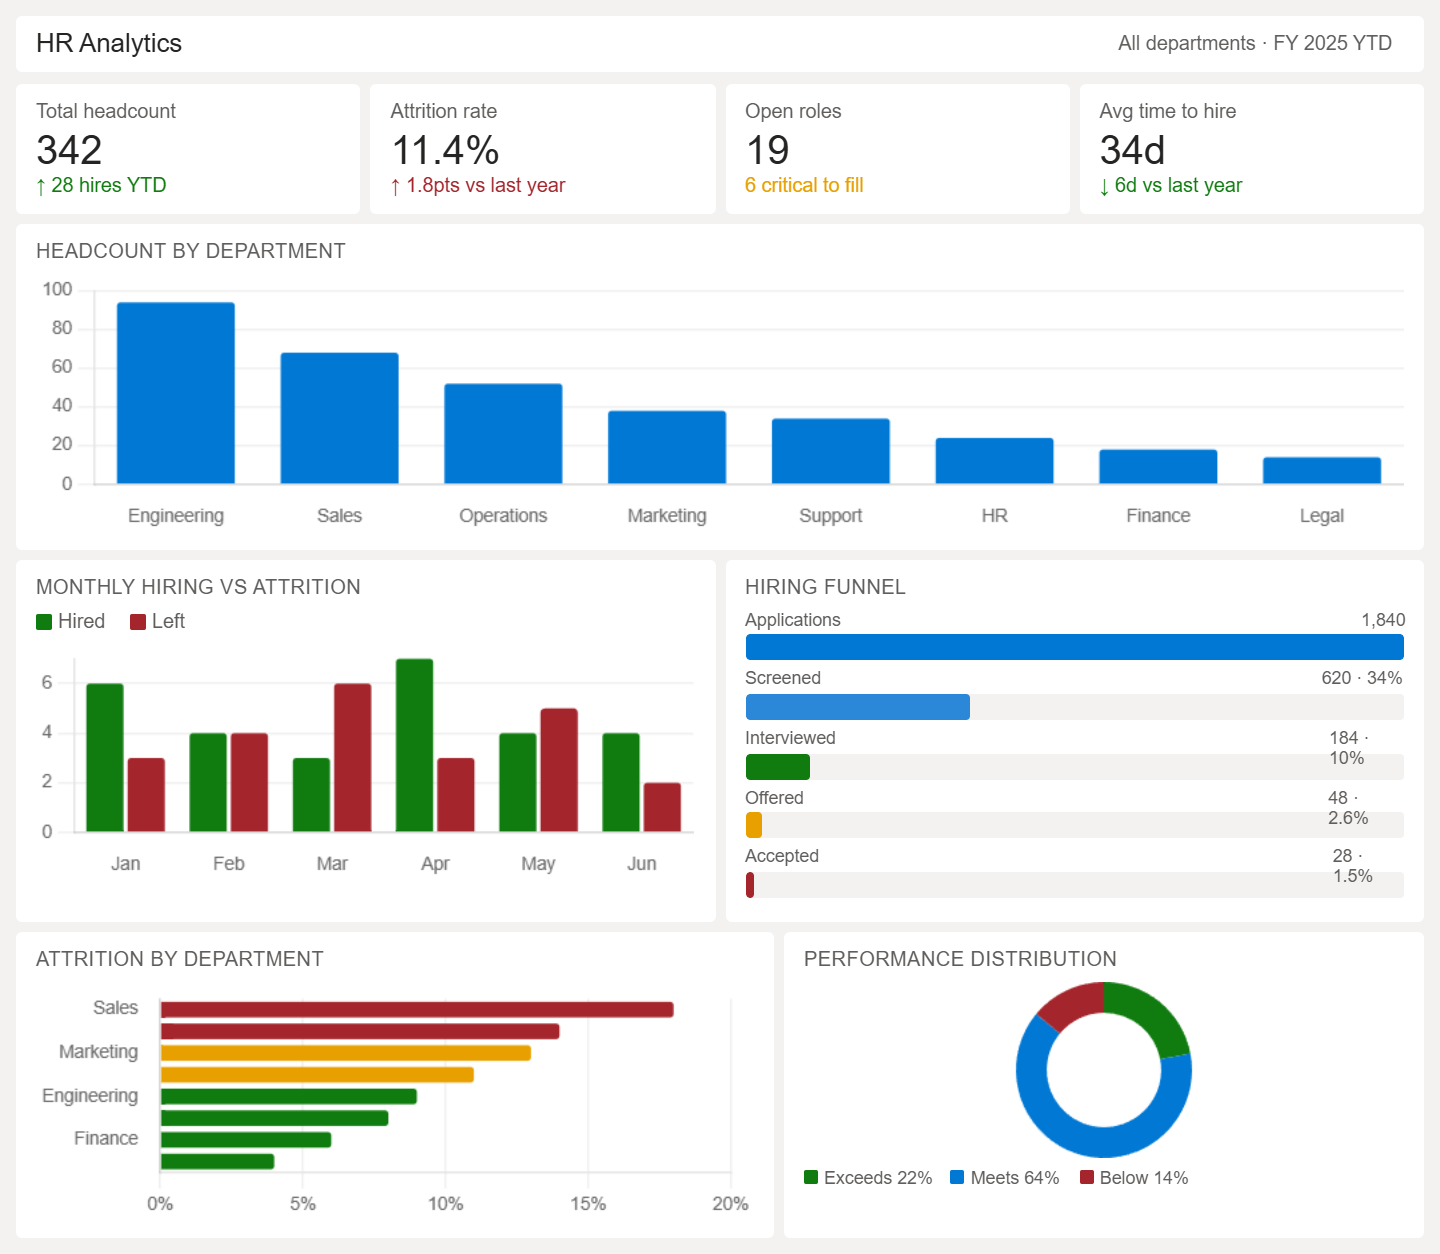
An HR analytics dashboard tracks employee data to help HR teams understand workforce performance, hiring trends, and retention patterns.
- Tracks employee headcount and workforce distribution
- Monitors hiring, onboarding, and attrition trends
- Analyzes employee performance and productivity metrics
- Shows attendance, leave, and engagement patterns
- Identifies retention risks and turnover trends
- Breaks down workforce data by department or role
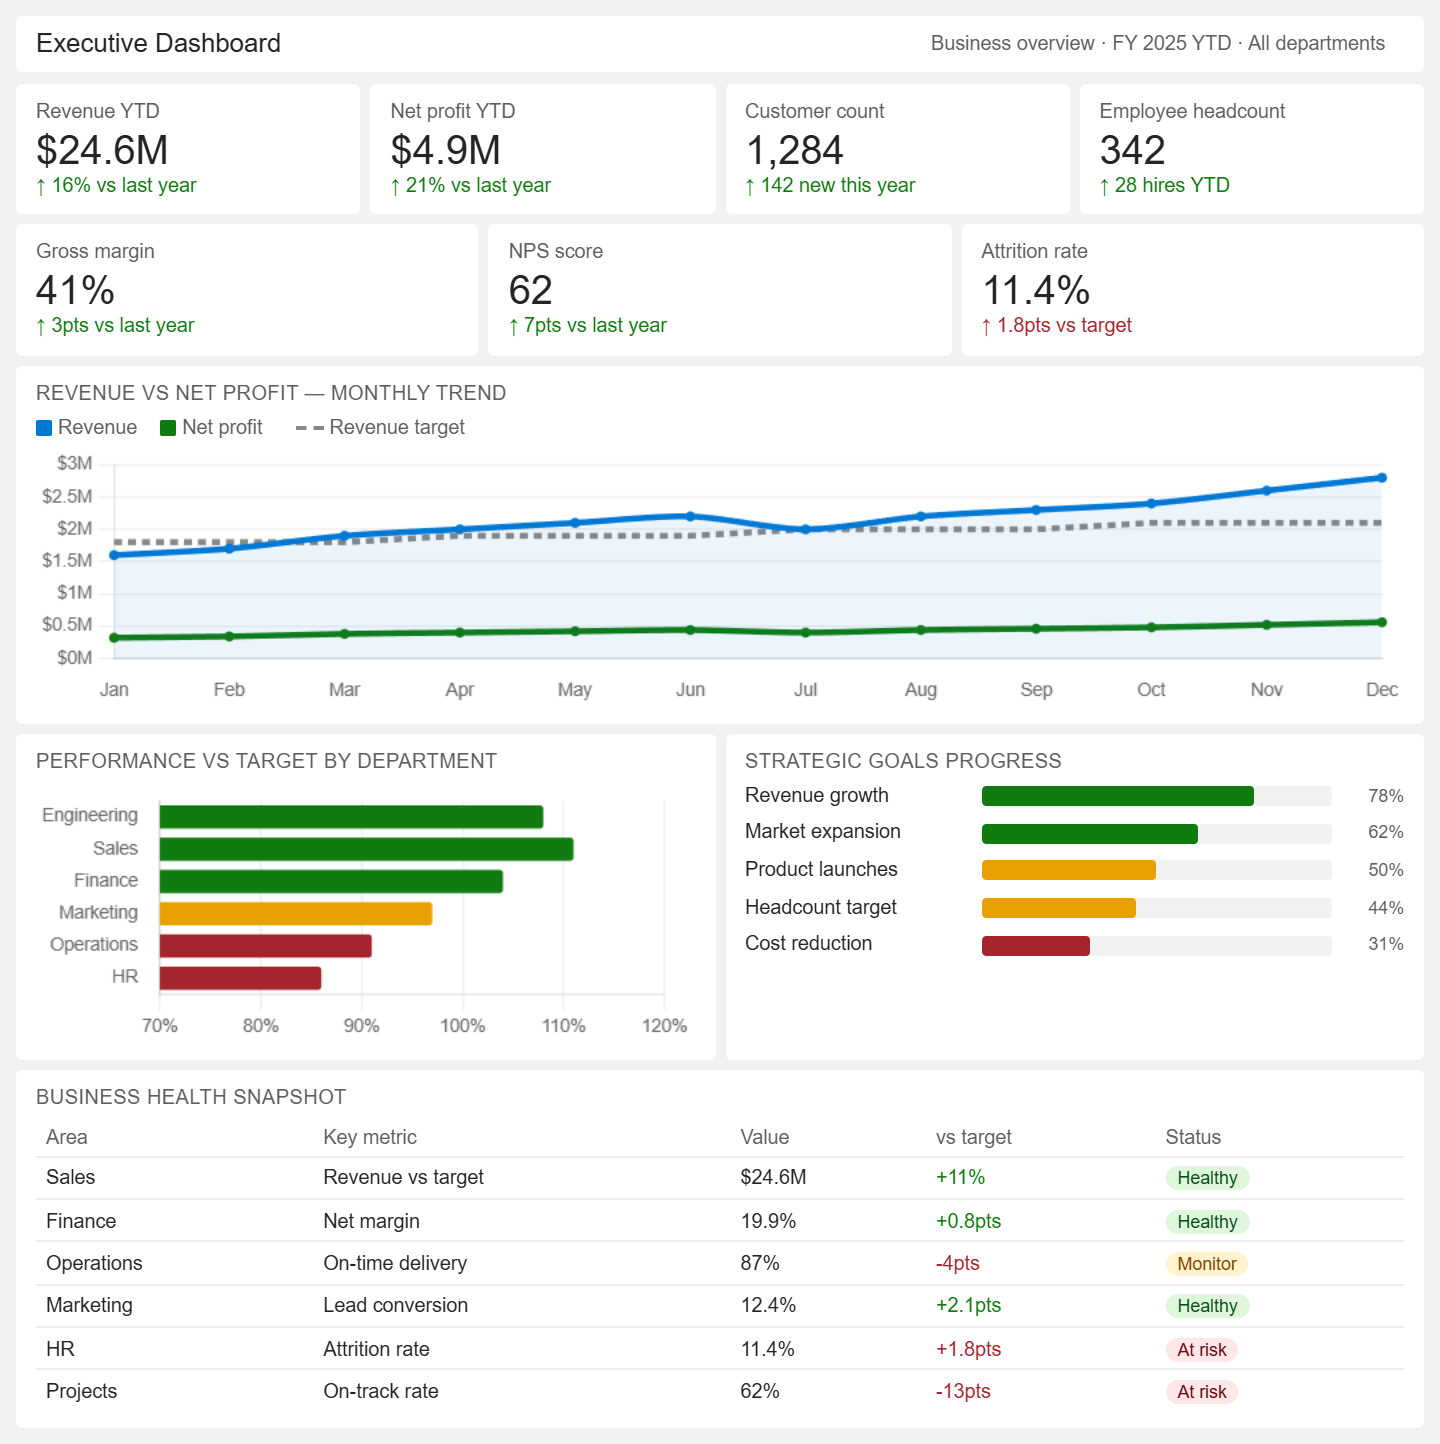
An executive dashboard provides a high-level view of overall business performance for leadership decision-making.
- Consolidates key business KPIs across departments
- Tracks revenue, profit, and overall growth trends
- Monitors operational and financial performance together
- Highlights performance against strategic goals
- Identifies risks and critical business changes
- Provides a real-time snapshot of business health
When to Build Custom Power BI Dashboards
Off-the-shelf vs Custom
Standard templates fall short when business-specific KPIs, workflows, or reporting structures are involved. Custom dashboards provide control over metrics, layout, and data modeling to reflect how the business actually operates.
Integration Needs
When data comes from multiple systems like CRM, ERP, APIs, or databases, a custom approach ensures consistent definitions and a unified view without manual consolidation or fragmented reporting.
Scaling Requirements
As data volume, users, and reporting complexity grow, dashboards need to support better performance, flexible design, and scalable architecture without slowing down or breaking existing reports.
Conclusion
Power BI dashboards consolidate business data into a single view, making it easier to track performance across sales, marketing, finance, operations, and HR. These Power BI dashboard examples show how businesses can remove dependency on manual reporting and scattered data sources. Well-structured dashboards improve visibility, reduce reporting effort, and make performance tracking more consistent across different business areas.
FAQs
How do Power BI dashboard examples help in planning a dashboard?
They give you a clear idea of how to structure layouts, choose the right visuals, and define KPIs before you start building your own dashboard.
Are there ready-made Power BI dashboard templates available?
Yes, Microsoft AppSource and the Power BI community offer a wide range of ready-made Power BI dashboard templates across sales, finance, HR, and operations. These can be imported directly and customized to match your business data and reporting needs.
What are some creative Power BI dashboard ideas for tracking business performance?
You can build dashboards around employee productivity, customer lifetime value, supply chain efficiency, or marketing ROI. The key is identifying metrics that directly impact business decisions and aren’t being tracked consistently yet.