Table of Contents
- 1. Introduction
- 2. What is Power BI Oil and Gas Analytics?
- 3. Power BI for Oil and Gas Industry Use Cases
- 4. Oil and Gas Analytics Using Power BI Dashboards
- 5. Power BI Oil and Gas Data Visualisation Capabilities
- 6. Power BI Integration with Oil and Gas Data Sources
- 7. Why Choose Power BI for Oil and Gas Analytics?
- 8. Conclusion
- 9. Frequently Asked Questions
The oil and gas sector is evolving faster than ever. Volatile commodity prices, stricter regulations, ageing assets, and growing pressure to operate sustainably have made data-driven decision-making non-negotiable.
Across upstream, midstream, and downstream operations, organisations generate enormous volumes of operational, financial, and safety data every single day. The real challenge is not collecting this data, but converting it into insights that leaders can trust and act upon.
This is where Power BI oil and gas analytics delivers real value.
Power BI provides a unified analytics layer that connects production systems, financial platforms, operational databases, and external data sources into a single, interactive view.
Instead of fragmented reports and delayed spreadsheets, decision-makers gain clarity on production performance, operating costs, safety metrics, and asset health in near real time.
Why Data Analytics Matters in Oil and Gas.
Oil and gas operations are among the most data-intensive industrial environments.
Sensors on drilling rigs, production equipment, pipelines, and refineries continuously generate performance data. Alongside this, enterprise systems capture financial transactions, maintenance records, workforce activity, and compliance information.
Without analytics, this data remains siloed. Teams react to issues after they occur rather than preventing them. Analytics enables oil and gas companies to identify trends, predict outcomes, and optimise performance before problems escalate.
Oil and gas data analytics supports smarter decisions around production planning, cost control, asset utilisation, and risk management.
In a sector where marginal gains translate into significant financial impact, analytics is a strategic capability.
Role of Power BI in the Energy Sector
Power BI, part of the analytics ecosystem from Microsoft, is designed to handle large, complex datasets while remaining accessible to business users.
In the energy sector, Power BI acts as a unified semantic and reporting layer that helps organisations move toward a single source of analytical truth departments and regions.
It enables organisations to connect disparate systems, apply consistent data models, and deliver insights through interactive dashboards.
This consistency is critical for large oil and gas enterprises operating across multiple assets and geographies, including the UK, North Sea, and international markets.
How Power BI Simplifies Oil & Gas Decision-Making
Power BI simplifies decision-making by presenting information visually and contextually.
Executives can view high-level KPIs, while operations teams drill down into asset-level data using the same platform.
Dashboards update automatically based on scheduled refresh, DirectQuery, or streaming configurations, reducing dependency on manual reporting.
This ensures decisions are based on current, reliable information rather than historical snapshots.
Power BI vs Traditional Reporting in Oil & Gas
Traditional reporting relies heavily on static documents and spreadsheets.These reports are time-consuming to produce and often lack transparency.
Power BI modernizes and significantly reduces reliance on static reporting [with interactive dashboards, automated refreshes, and role-based access.
The result is faster insight delivery, improved trust in data, and better collaboration across teams.
Power BI for Oil and Gas Industry Use Cases
The oil and gas industry operates across complex, data-intensive environments. Operational decisions depend on near-real-time visibility and historical performance insights. Power BI enables unified reporting across upstream, midstream, and downstream operations. It converts operational, production, and asset data into clear, actionable dashboards. This helps teams improve efficiency, reduce risk, and optimise costs across the value chain.
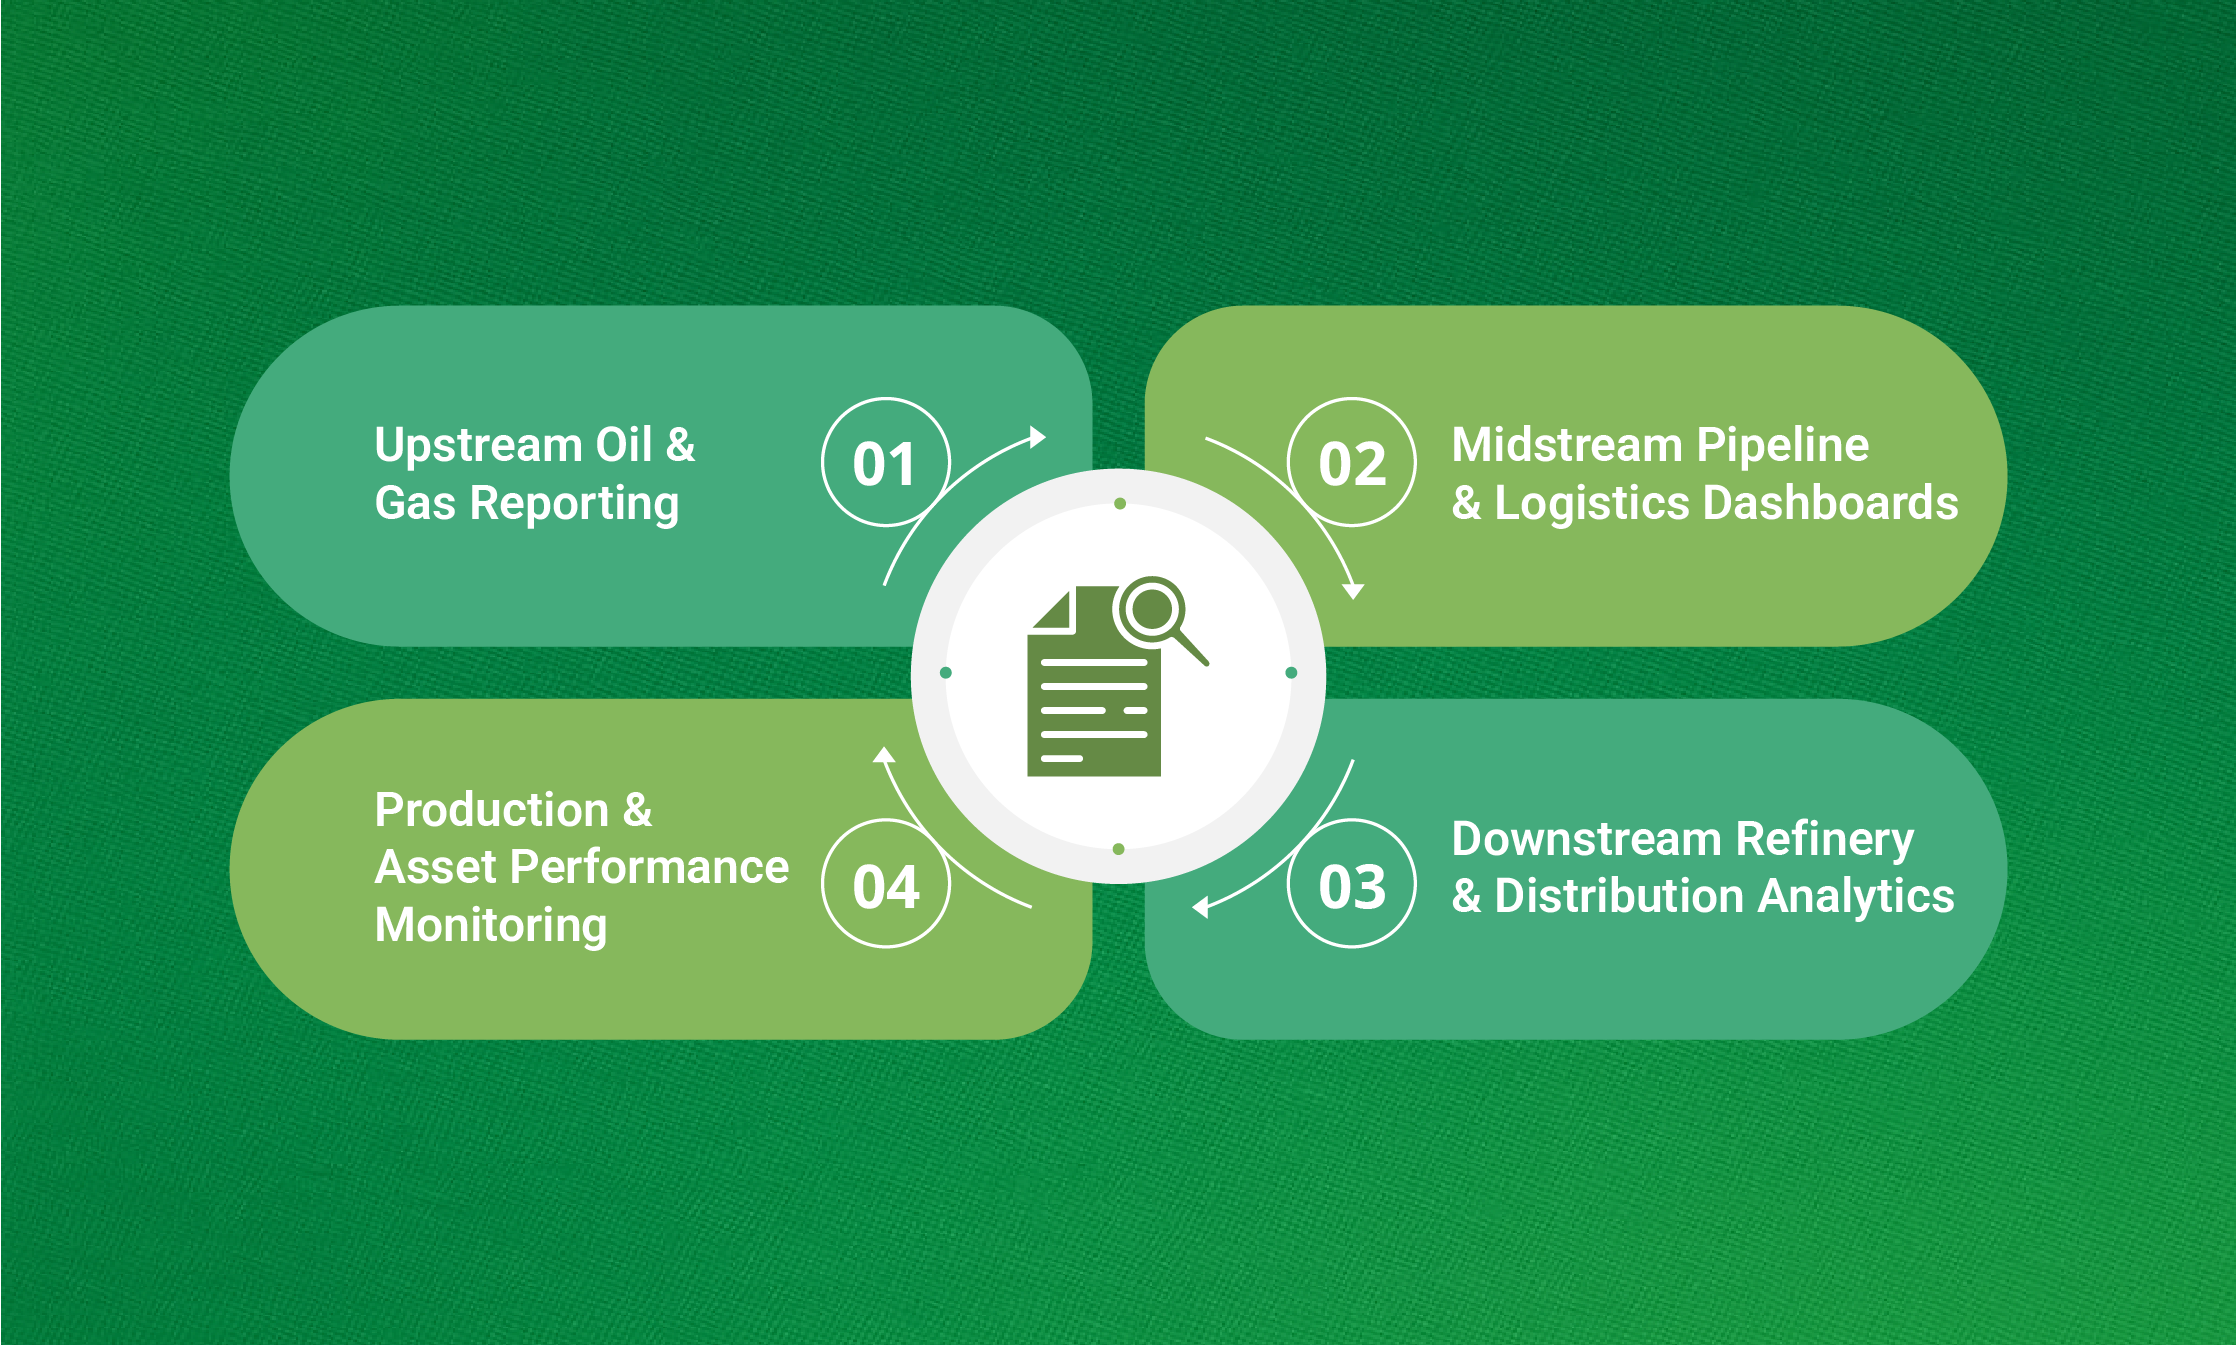
Upstream Oil and Gas Reporting
Upstream operations cover exploration, drilling, and production, and Power BI enables clear visibility into well performance, drilling efficiency, and production trends by consolidating data from drilling systems, production databases, and operational logs into a single dashboard, allowing engineers to quickly identify declining output, abnormal pressure readings, or inefficiencies and take early action to reduce downtime and improve recovery rates.
Midstream Pipeline & Logistics Dashboards
Midstream operations rely on efficient transportation and storage, and Power BI dashboards visualise pipeline throughput, storage utilisation, logistics performance, and operational risks by combining operational and logistics data into a single view, helping teams identify bottlenecks, capacity constraints, and safety concerns while supporting better planning, compliance management, and cost optimisation.
Downstream Refinery & Distribution Analytics
Downstream operations require close monitoring of refinery performance and distribution efficiency, and Power BI dashboards track throughput, yield, energy consumption, and distribution metrics, helping managers identify inefficiencies that impact margins while enabling performance comparisons across plants or time periods for continuous improvement and operational benchmarking.
Production & Asset Performance Monitoring
Asset performance monitoring focuses on equipment health and reliability, and Power BI dashboards track maintenance history, failure trends, and utilisation rates, enabling teams to analyse historical patterns, identify indicators of potential failures, plan maintenance proactively, reduce unplanned outages, and extend asset lifespan.
Oil and Gas Analytics Using Power BI Dashboards
Oil and gas analytics require timely, accurate insights across operations, finance, and safety, and Power BI dashboards bring together data from multiple systems into a single analytical view, enabling near-real-time visibility, KPI-driven decision-making, cost and performance analysis, and proactive safety and compliance monitoring across the entire oil and gas value chain.
Near-Real-Time Oil and Gas Dashboards
Real-time dashboards provide near-live (near-real-time) visibility into operational conditions.
When connected to frequently refreshed, DirectQuery, or streaming data source, Power BI enables teams to monitor production, safety, and logistics continuously. This capability is particularly valuable in high-risk operational environments where timely decisions matter.
Energy KPI Dashboards for Leadership
Leadership teams rely on energy KPI dashboards to monitor production targets, operating costs, emissions, and profitability. Power BI presents these KPIs clearly, enabling executives to focus on trends rather than raw data. This supports strategic planning, performance management, and investment decisions.
Financial & Cost Performance Analysis
Power BI connects operational data with financial systems to deliver comprehensive cost insights. Finance teams can analyse cost per barrel, operating expenditure, and budget variance across assets and regions. This alignment between finance and operations improves transparency and financial discipline.
Safety & Compliance Monitoring
Safety and compliance dashboards track incidents, near misses, and regulatory KPIs, and Power BI supports proactive risk management and clear reporting for audits and inspections, while complementing operational safety and compliance systems rather than replacing them, enabling organisations to identify risk patterns early and strengthen overall safety performance.
Power BI Oil and Gas Data Visualisation Capabilities
Effective oil and gas decision-making depends on clear and intuitive data visualisation, and Power BI enables interactive, drill-down, and geospatial dashboards that present energy-specific KPIs in a format aligned with operational workflows, helping teams understand performance quickly, analyse issues in depth, and act with confidence across complex oil and gas environments.
Interactive Reports for Energy Teams
Interactive reports allow users to explore data dynamically. Energy teams can apply filters, compare scenarios, and analyse trends without technical support. This encourages wider adoption of analytics across the organisation.
Drill-Down Views for Operations Managers
Drill-down functionality enables managers to move from summary views to detailed asset-level insights if the underlying data model supports it. This accelerates root-cause analysis and supports faster corrective action.
Geospatial Mapping for Oil Fields & Pipelines
Geospatial visuals display wells, pipelines, and facilities on interactive maps.
This spatial context improves understanding of production distribution and operational risk.
Custom Visuals for Energy KPIs
Custom visuals can be added to ensure dashboards reflect oil and gas-specific KPIs. This alignment improves clarity and relevance for operational teams.
Power BI Integration with Oil and Gas Data Sources
Oil and gas analytics depends on seamless data integration across enterprise, operational, and engineering systems, and Power BI connects ERP, financial, production, reservoir, and hybrid cloud or on-premise data sources into a unified reporting layer when combined with proper data modeling and governance, enabling consistent, reliable insights that support operational optimisation, financial transparency, and informed decision-making across the organisation.
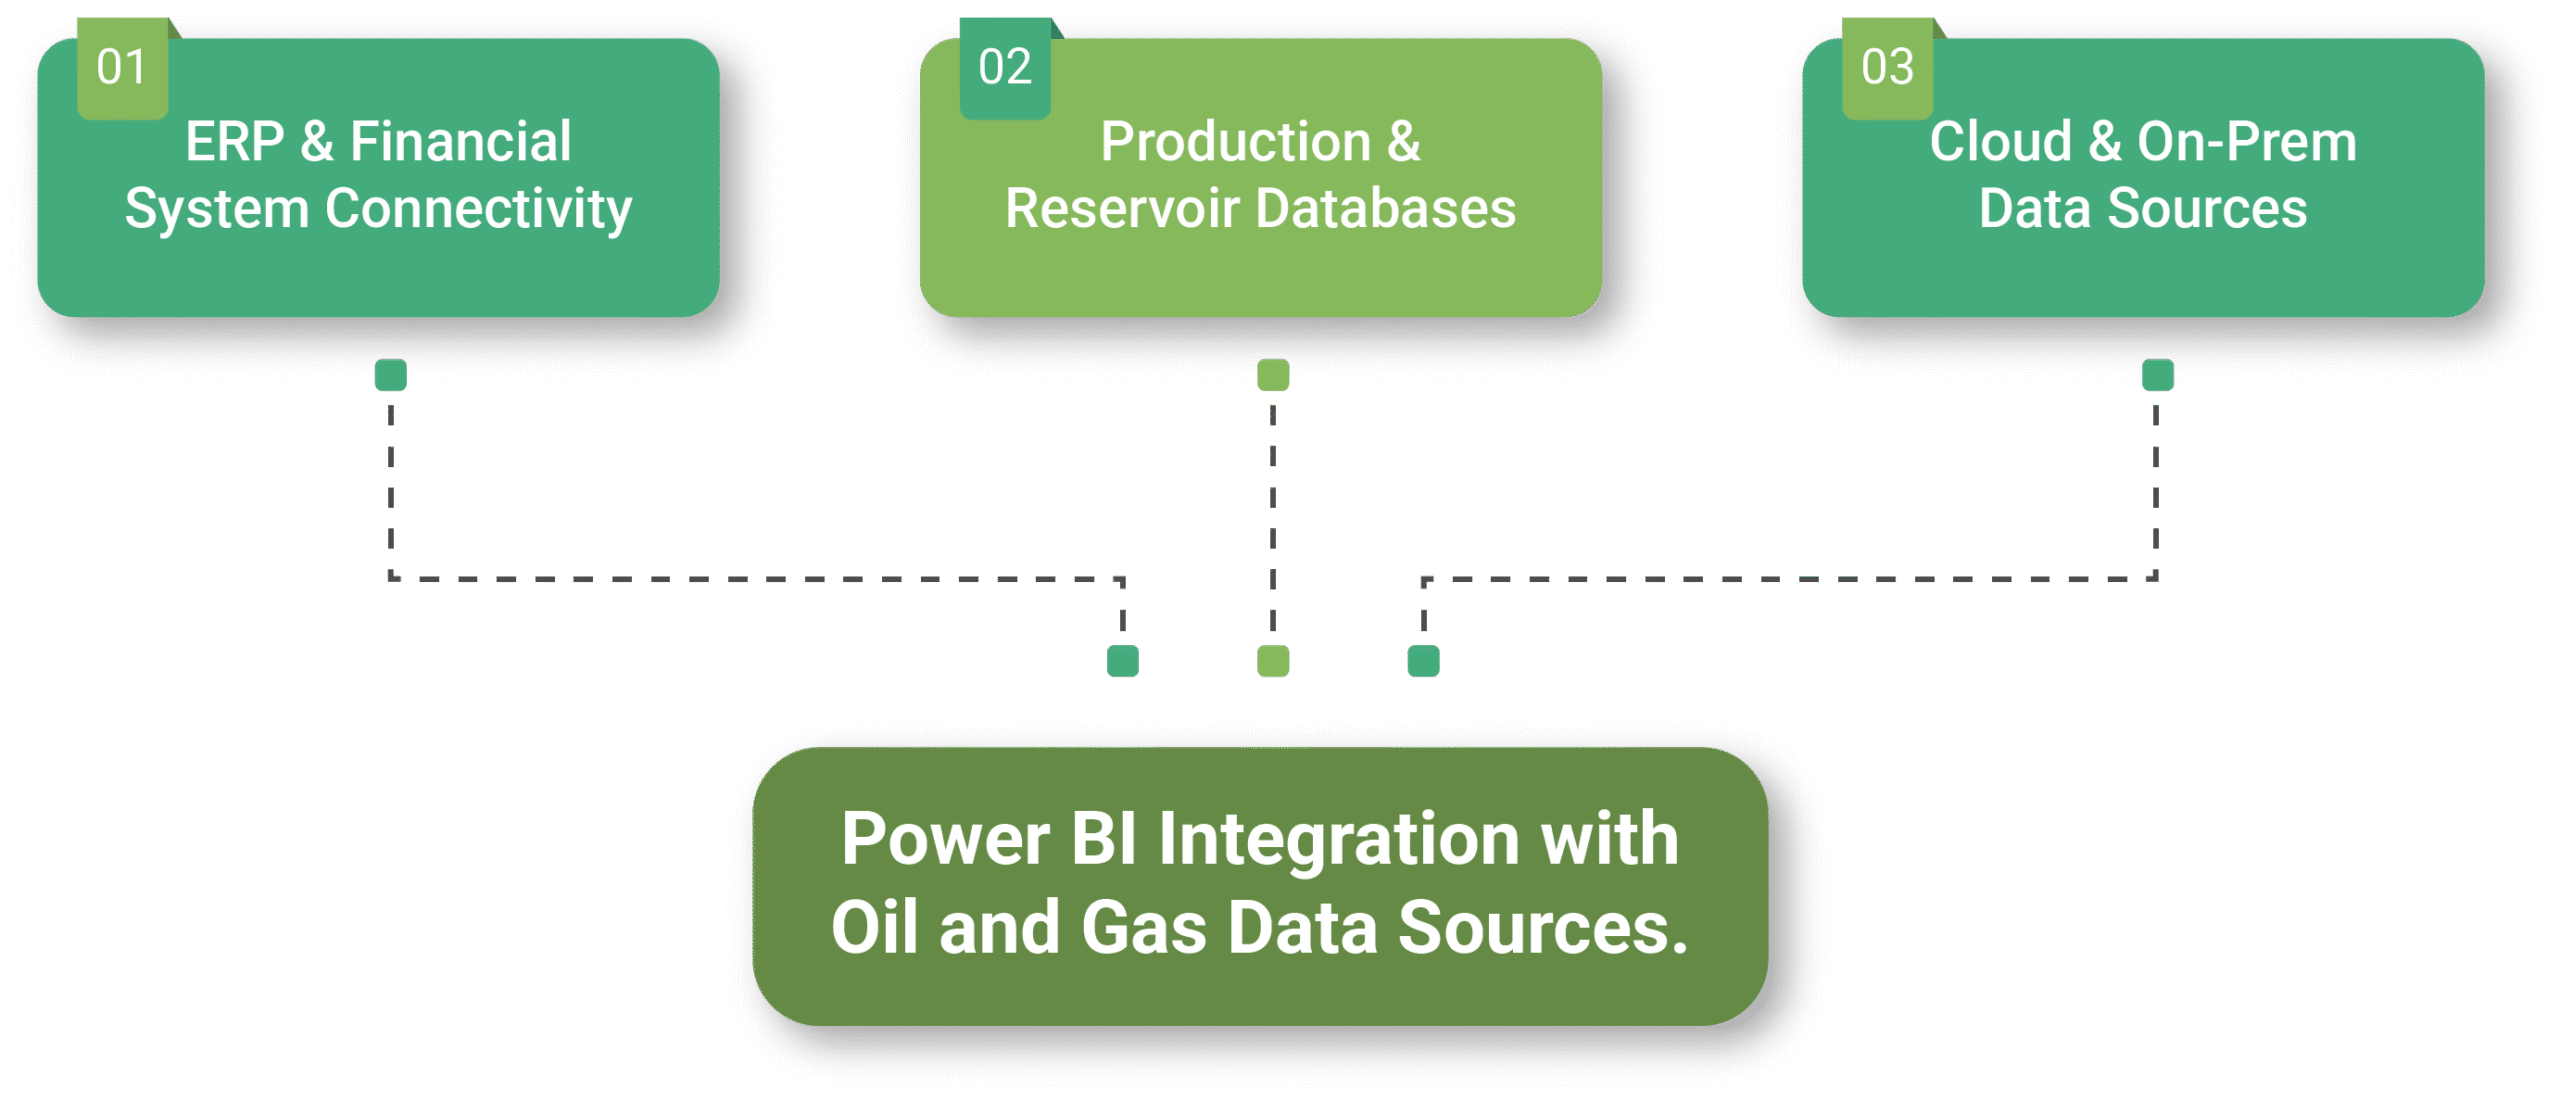
ERP & Financial System Connectivity
Power BI integrates with ERP and finance systems to unify operational and financial data.
This creates a holistic view of performance across the organisation.
Production & Reservoir Databases
Integration with production and reservoir databases enables deeper analysis of output trends and reservoir behaviour. Engineers gain insights that support analytical optimisation and planning and long-term planning.
Cloud & On-Prem Data Sources
Power BI supports both cloud-based and on-premise data sources. This flexibility suits oil and gas organisations operating hybrid environments common in the UK and Europe.
Why Choose Power BI for Oil and Gas Analytics?
Built for Large-Scale Energy Data
Power BI is designed to handle high-volume, high-complexity datasets. It scales across assets, regions, and business units.
Secure & Compliance-Ready Platform
Role-based access, governance controls, and audit features support regulatory compliance.
This makes Power BI suitable for sensitive oil and gas data.
Easy Adoption for Business Users
Power BI’s intuitive interface enables self-service analytics. Business users can generate insights without heavy reliance on IT teams.
Future-Ready Analytics for the Energy Industry
With AI-assisted insights such as Q&A, visual explanations, and Copilot features and continuous innovation, Power BI supports future analytics needs as part of a broader analytics strategy.
This positions energy organisations for long-term digital transformation.
Conclusion
The oil and gas industry faces constant pressure to improve efficiency, manage risk, and adapt to change. Traditional reporting struggles to handle the scale and complexity of modern energy operations. Power BI enables visualisation and analysis of oil and gas data, turning it into clear, actionable insights. It provides visibility across production, finance, safety, and asset performance. This enables faster, more confident, and better-aligned decision-making. More importantly, Power BI supports a shift towards a truly data-driven culture.
Frequently Asked Questions
What is Power BI oil and gas analytics?
It is the use of Power BI to analyse and visualise oil and gas operational, financial, and performance data.
How is Power BI used in the oil and gas industry?
It supports reporting and analytics across upstream, midstream, and downstream operations.
Can Power BI support real-time oil and gas dashboards?
Yes, Power BI supports near-real-time reporting with frequent data refresh.
Is Power BI suitable for large energy enterprises?
Yes, it is scalable and secure for enterprise-grade oil and gas environments.
What KPIs can be tracked using Power BI in oil and gas?
Production volumes, cost per barrel, asset reliability, safety metrics, and energy efficiency.