Introduction to Power BI and Tableau
What is Power BI?
Power BI is Microsoft’s cloud-based analytics platform designed to make business intelligence widely accessible. It integrates naturally with Excel, SQL Server, Microsoft 365, and Azure, allowing organisations to consolidate their analytics workflows within a familiar ecosystem. Power BI simplifies data preparation, modelling, and dashboard creation, making it a strong option for teams that prefer structured, intuitive analytics without sacrificing depth.
What is Tableau?
Tableau is a specialised visual analytics platform known for its advanced design freedom and high-end data visualisation capabilities. It is engineered for deep data exploration, offering granular control over every element of a dashboard. Tableau is widely used by analysts who require sophisticated visuals, complex calculations, and the ability to work fluidly with large or varied datasets across multiple environments.
Power BI vs Tableau: Key Differences
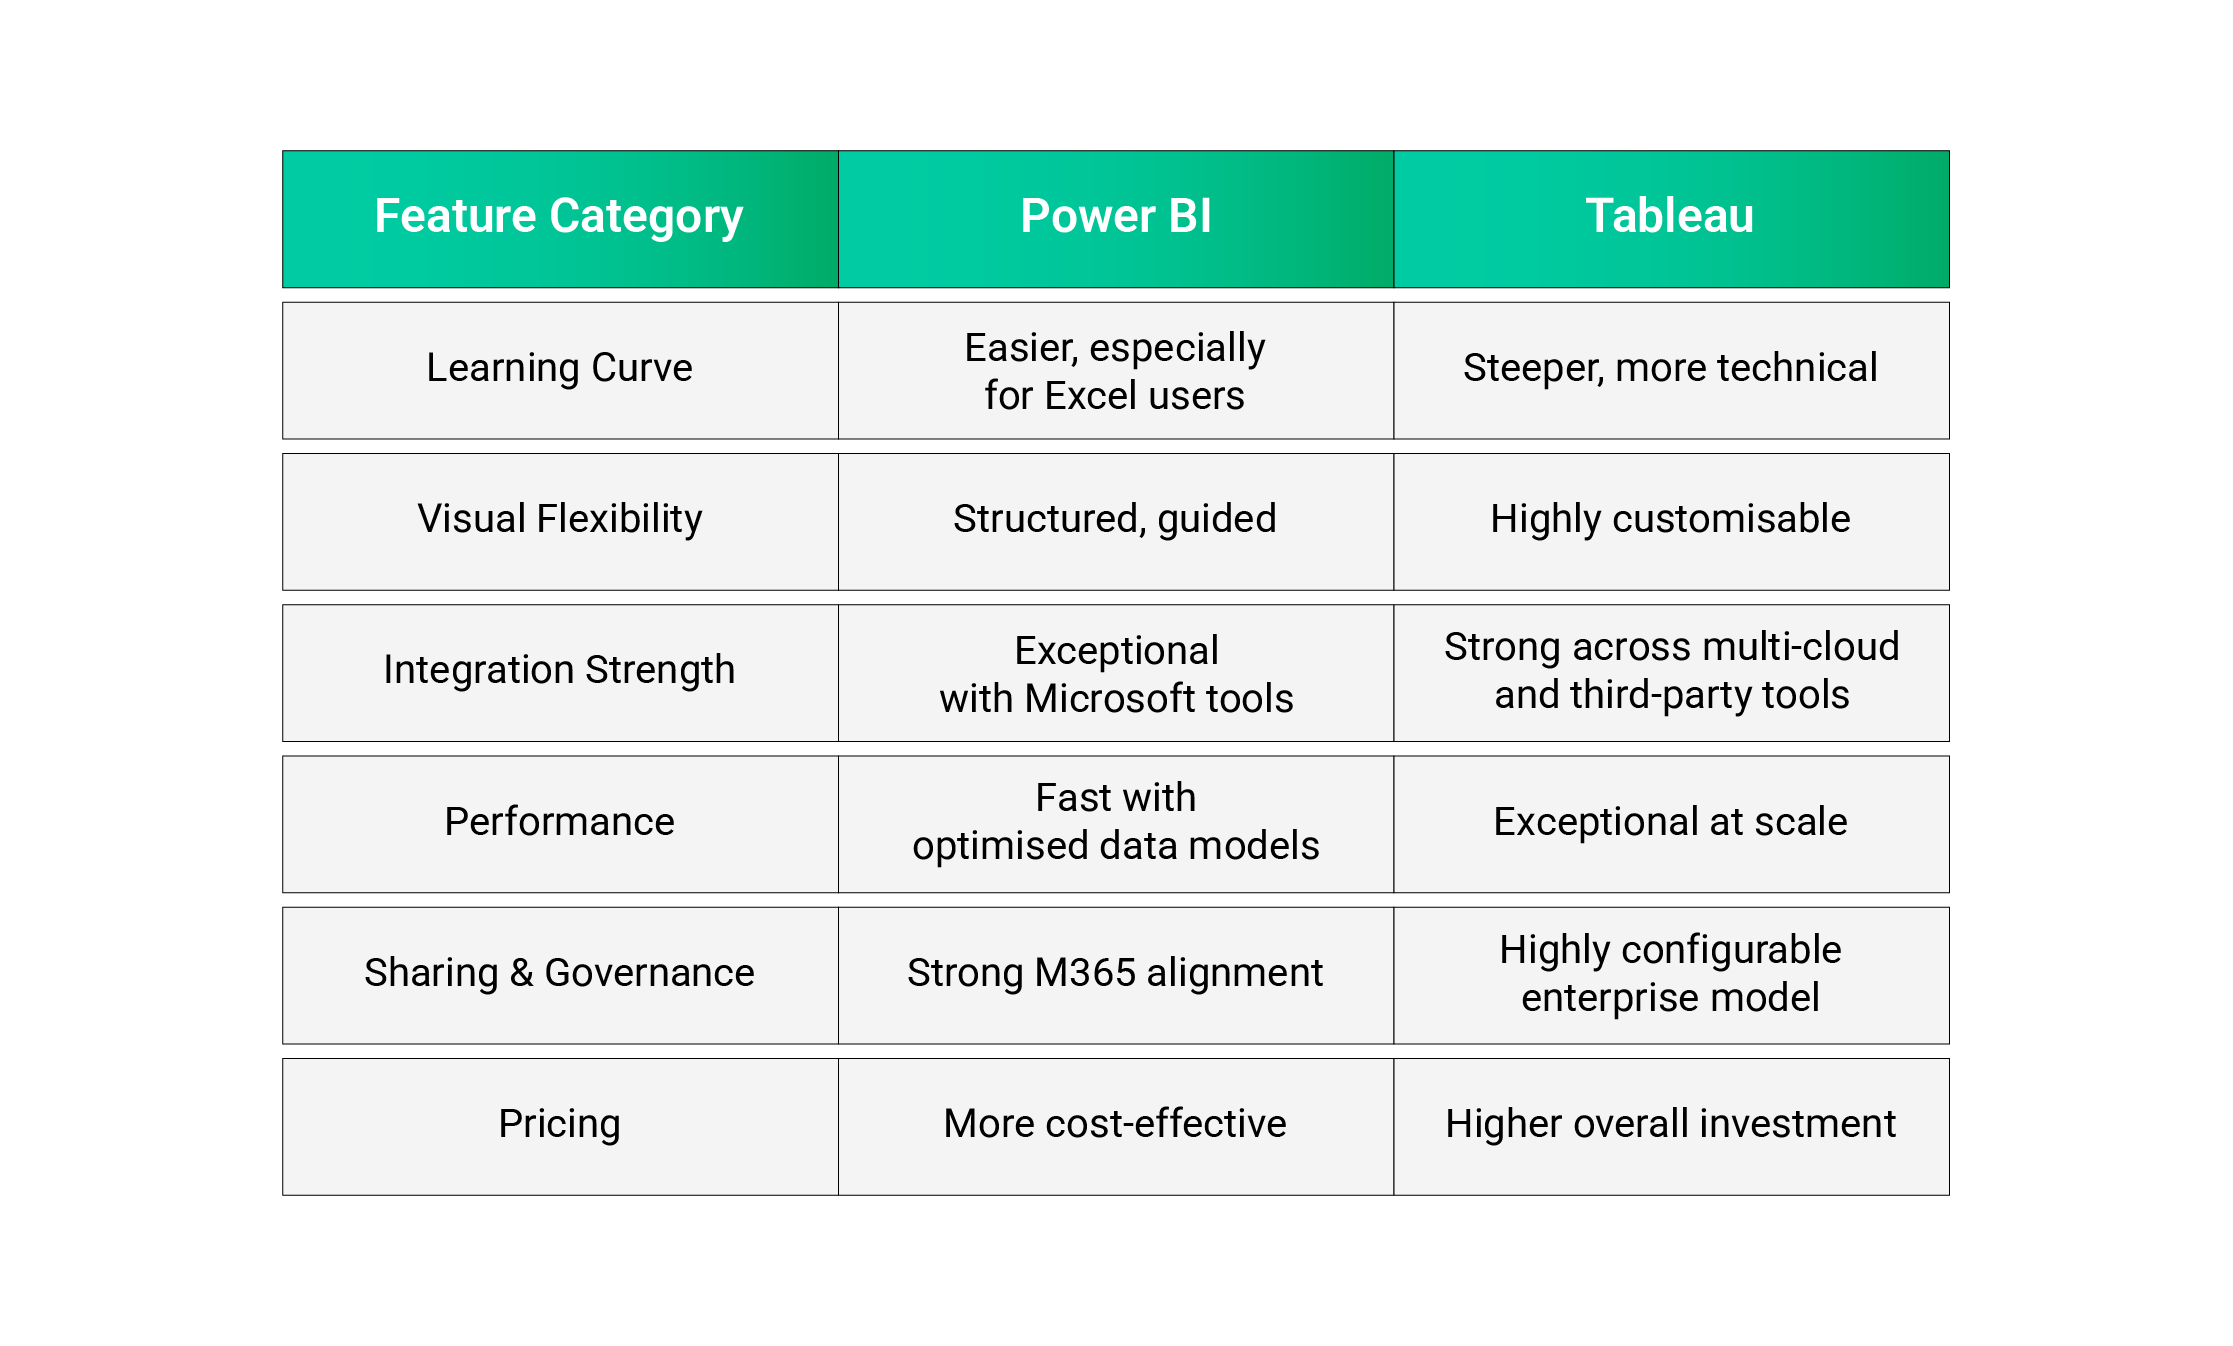
Comparison Table: Power BI vs Tableau Features
User Interface and Usability.
A business intelligence tool only works if people actually use it. The way a platform looks, feels, and guides users has a direct impact on adoption. Power BI and Tableau approach this in two very different ways, and those differences matter depending on who’s using them.
Power BI: Familiar, Structured, No-Nonsense.
Power BI sticks to the Microsoft way of doing things clean layout, ribbon menus, panels on the side, and drag-and-drop everywhere. Anyone who spends their day in Excel or PowerPoint settles into Power BI quickly.
The 2025 update polished the workspace even more. Navigation feels lighter, report building flows better, enhancing AI capabilities, and mobile layouts finally feel built for actual day-to-day use, not as an afterthought. Touch gestures, offline availability, and smoother transitions make it easier for teams on the move.
Where the challenge begins is with deeper modeling and formulas. Understanding relationships, measures, and especially DAX can take time. Power BI keeps the surface simple but hides a lot of enterprise-level capability underneath great for Microsoft-heavy organizations, but something to plan training around.
Tableau: Freedom, Craft, and Full Creative Control.
Tableau starts from a different place. Instead of guiding you through panels and steps, it gives you a wide-open canvas. You build visuals the way you imagine them freeform layouts, fine-grain styling, custom interactions, and objects that behave exactly how you want them to.
This flexibility is a dream for analysts and designers who like to shape every detail. Filters, tooltips, drill paths, and parameters all feel natural once you get the hang of them. The output often looks more polished out of the box, especially for presentation-ready dashboards.
But that freedom has a cost. New users, especially those without analytical backgrounds, can feel lost at first. Tableau rewards curiosity, experimentation, and time a good match for teams with specialized analysts, but a tougher fit for broad organizational rollout without training.
Which One Fits Your Team?
If your organization relies on Microsoft tools and needs fast, frictionless adoption, Power BI lines up neatly with how your teams already work.
If your analysts want maximum control, want to craft bespoke visuals, or need dashboards that lean heavily on design, Tableau delivers depth worth investing in.
Both tools are strong. The difference lies in how your people think, create, and collaborate.
Feature-by-Feature Comparison.
Data Connectivity and Integration:
Power BI is strongest within the Microsoft ecosystem. Its native connectors to Excel, SQL Server, Azure databases, Dataverse, and SharePoint make integration seamless for organisations already using Microsoft technologies. Composite models and DirectQuery options give Power BI flexibility without overcomplicating setup.
Tableau’s advantage lies in its neutrality. It integrates widely across AWS, Google Cloud, Snowflake, Oracle, SAP, Hadoop ecosystems, and countless third-party platforms. Organisations with diverse or multi-cloud environments often benefit from Tableau’s broad and deep connector library.
Data Visualization and Customization:
Tableau maintains its reputation as the most capable visualisation engine in the BI industry. Its ability to layer visuals, construct complex patterns, and shape detailed interactions makes it the preferred choice for analysis-heavy teams.
Power BI provides strong visual options as well, but within a more defined structure. Custom visuals and DAX calculations expand capability, yet the platform’s intention remains clarity and business-oriented reporting rather than deep visual experimentation.
Performance and Speed:
Power BI uses the VertiPaq engine, an in-memory analytics engine known for its compression and speed. It performs exceptionally well when dashboards rely on curated datasets and well-modelled tables.
Tableau’s uses VizQL translates your drag-and-drop actions into queries, while Hyper executes those queries efficiently on large data. So for a statement about performance and handling large/detailed data, it’s more accurate to emphasize.
Collaboration and Sharing Capabilities:
Power BI integrates collaboration directly into Microsoft 365. Dashboards can be shared through Power BI Service, embedded into Teams, linked to SharePoint, and governed through Azure Active Directory. This creates a consistent security perimeter across all tools.
Tableau supports collaboration through Tableau Cloud and Tableau Server. Its governance model allows detailed control over user roles, permissions, and content distribution. It is extremely scalable but requires more deliberate configuration compared to Power BI’s native ecosystem alignment.
Pricing and Licensing Models
Power BI: Budget-Friendly, Enterprise Ready.
Power BI gives you strong analytics without heavy pricing.
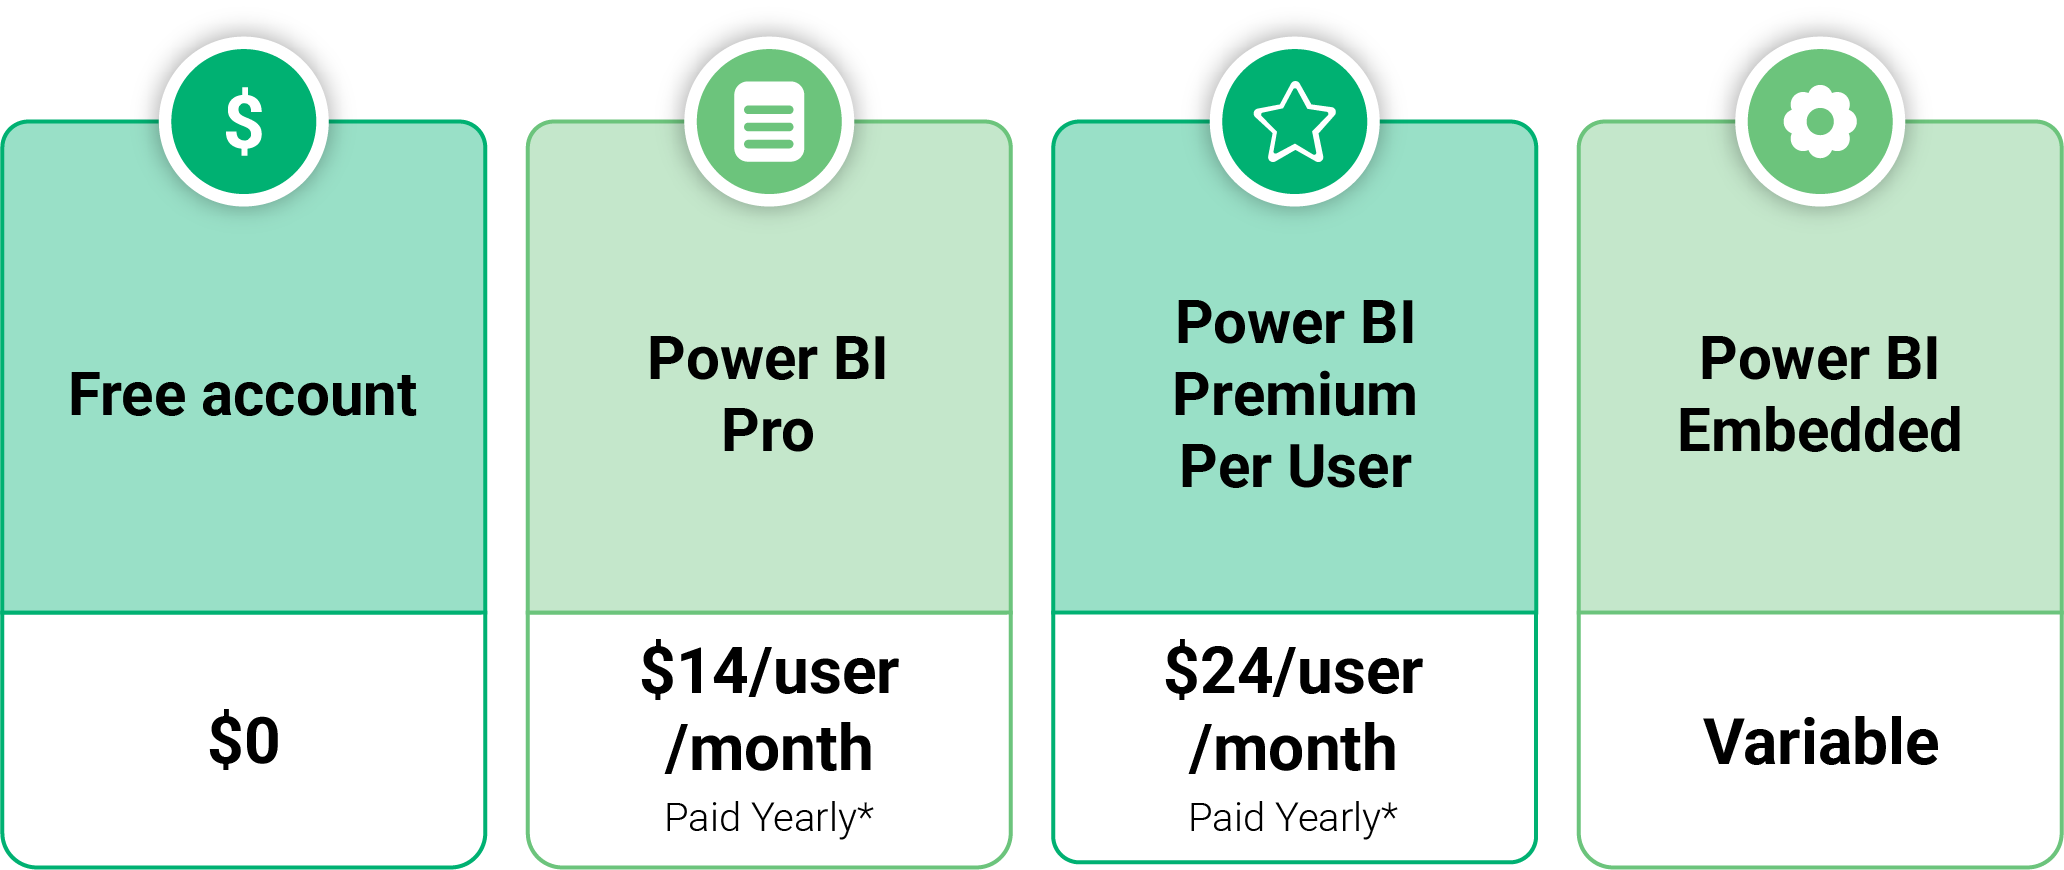
If your org already uses Microsoft 365, Dynamics, Excel, or Azure, Power BI becomes even more cost-efficient because everything connects out of the box. No extra tools. No heavy integrations. Faster adoption.
Tableau: Powerful, but Pricier
Tableau licenses are role-based:
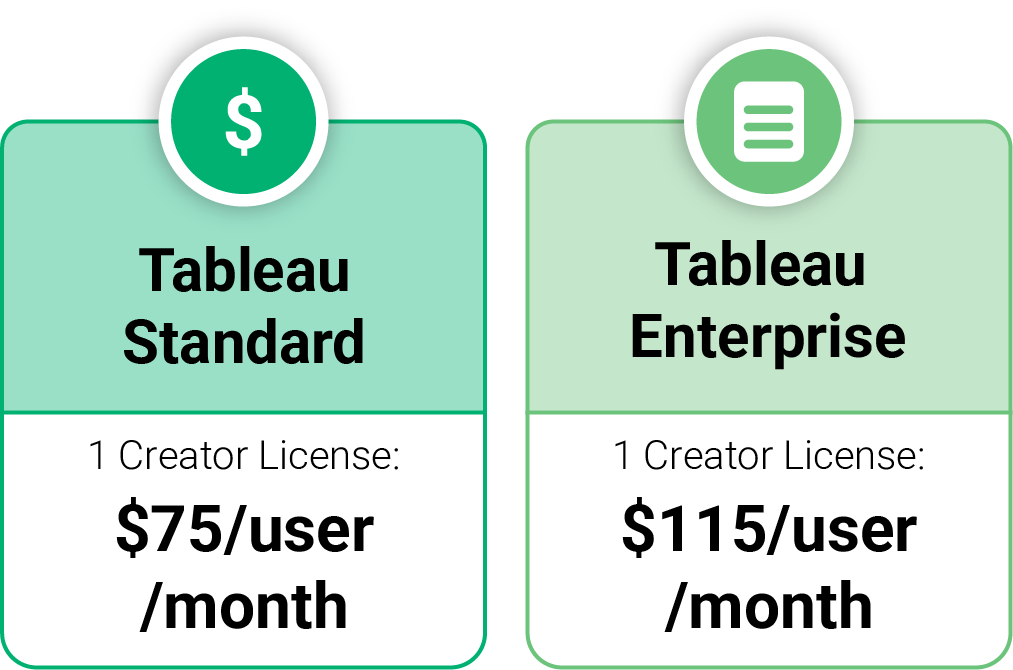
A mixed team of 100 users can cost 3–5x more than Power BI.
Plus, Tableau’s minimum user requirements add to the cost.
The upside: Tableau excels in complex dashboards, heavy data workloads, and advanced visual storytelling. If visualization depth matters more than budget, teams still prefer it.
Which One Offers Better Value for Money?
Power BI generally offers better value, particularly for businesses aligned with Microsoft’s ecosystem or those emphasising cost efficiency. Tableau justifies its higher price for teams requiring advanced data exploration, complex modelling, or highly flexible visual design.
Which Tool Should You Choose?
Choosing Based on Organization Size
Smaller and mid-sized organisations tend to gain more immediate value from Power BI because it is easier to scale, simpler to adopt, and more cost-effective.
Enterprises with mature BI teams often lean toward Tableau due to the depth of its visual and analytical capabilities.
Choosing Based on Use Case
If the goal is operational reporting, KPI dashboards, and business-friendly insights, Power BI is usually more than sufficient.
If the goal is deep analytical exploration, layered visuals, or creation of advanced analytical experiences, Tableau stands out.
Choosing Based on Budget
Power BI remains the more economical platform. Tableau requires a higher investment but offers capabilities that justify the cost for teams that rely heavily on advanced visual analytics.
Conclusion.
Power BI and Tableau are both outstanding BI platforms, but they serve different priorities. Power BI delivers an accessible, integrated, and cost-effective analytics environment, while Tableau offers the most sophisticated visualization capabilities in the industry with performance designed for advanced analytics.
The right choice depends on whether your organisation values integration, ease of adoption, and cost efficiency – or advanced visual flexibility, neutrality across environments, and high-end analytical depth.
Frequently Asked Questions (FAQ)
Which is better, Power BI or Tableau, for data visualization?
Tableau is stronger for advanced visuals; Power BI is ideal for structured business reporting.
Is Power BI cheaper than Tableau?
Yes. Power BI is significantly more cost-effective, especially for Microsoft-focused organisations.
Can Power BI connect to Tableau?
They do not connect to each other directly, but both can connect to the same data sources.
Which tool is best for large enterprises?
Tableau suits enterprises needing advanced analytics; Power BI suits those focused on governance and integration
Which one is easier to learn for beginners?
Power BI is easier due to its familiar Microsoft interface and guided workflows.